


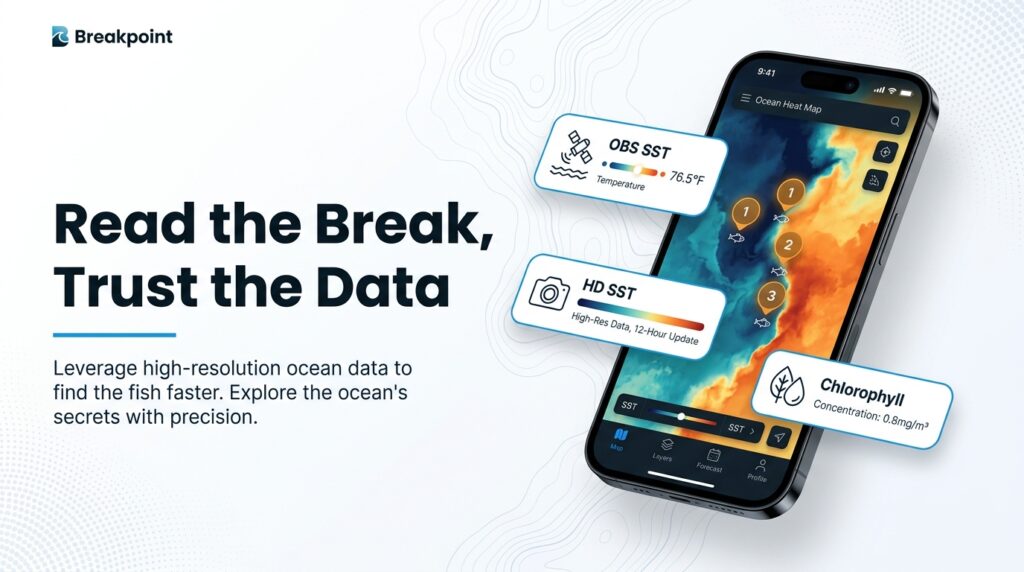
A temperature break is a narrow band where sea surface temperature changes quickly over a short distance. To read one well, check how old the image is, whether clouds or blending shaped it, and whether other layers agree.
The colors are easy to see. The data behind them is what determines whether the trip is worth the fuel. Suppose you’re looking at a tight color edge 40 miles out. Is the image fresh? Is the edge real, or is it just where a cloud mask ended? Those questions are worth answering before you point the bow.
If you’re new to breaks, start with our guide to reading temperature breaks. This piece covers how the imagery is made, where it fails, and how to use it anyway.
It covers:
- How the image is built, from sensor to cloud mask to blend
- Why observed and blended layers differ
- How to spot artifacts
- A repeatable pre-trip checklist
- Where the map stops and the deck takes over
Fish don’t read charts. The goal is a better decision about where to look.
What a Temperature Break Is, Physically
Start with the water rather than the satellite. A temperature gradient, sometimes called a thermal front, is any place where surface temperature changes across distance. A sharp break is a steep gradient: a lot of change in a short run.
Several things build these edges:
- Current edges. Major boundaries like the Gulf Stream, the Loop Current and the Kuroshio put warm and cool water side by side.
- Eddies. Warm-core and cold-core eddies spin off those currents and leave rings of contrast behind.
- Upwelling. Along coasts and headlands, cold water rises and meets warmer surface water.
- Shelf and slope features. Canyons and shelf edges can steer and shear the water above them.
A break on the surface is often the visible sign of something bigger: a current edge, a convergence, or upwelling. Judge sharpness by comparing the change with the water around it, not against a fixed threshold.
At the dock: a break is a clue about moving water, not a fish marker.
Why Pelagics Hold on Breaks, and Why Some Hold Nothing
BDOutdoors describes breaks as "convergence zones" where water masses meet, comparing them to "two conveyor belts running in different directions abutting each other." Floating material collects where they meet.
That sets up a chain. Nutrients feed phytoplankton, phytoplankton feed zooplankton, and zooplankton feed bait. Bait draws tuna, mahi, wahoo and billfish. Breaks concentrate bait more often than open water does, though that is a tendency and not a law.
Some breaks hold nothing. In The Spread notes that breaks alone may not hold fish if chlorophyll reveals barren water, which is why you cross-check with Chlorophyll. Even a well-layered map is a proposal, and experience on the water decides whether a break is working that day.
At the dock: a break raises the odds of a bite but doesn’t guarantee one.
How the SST Image Is Built
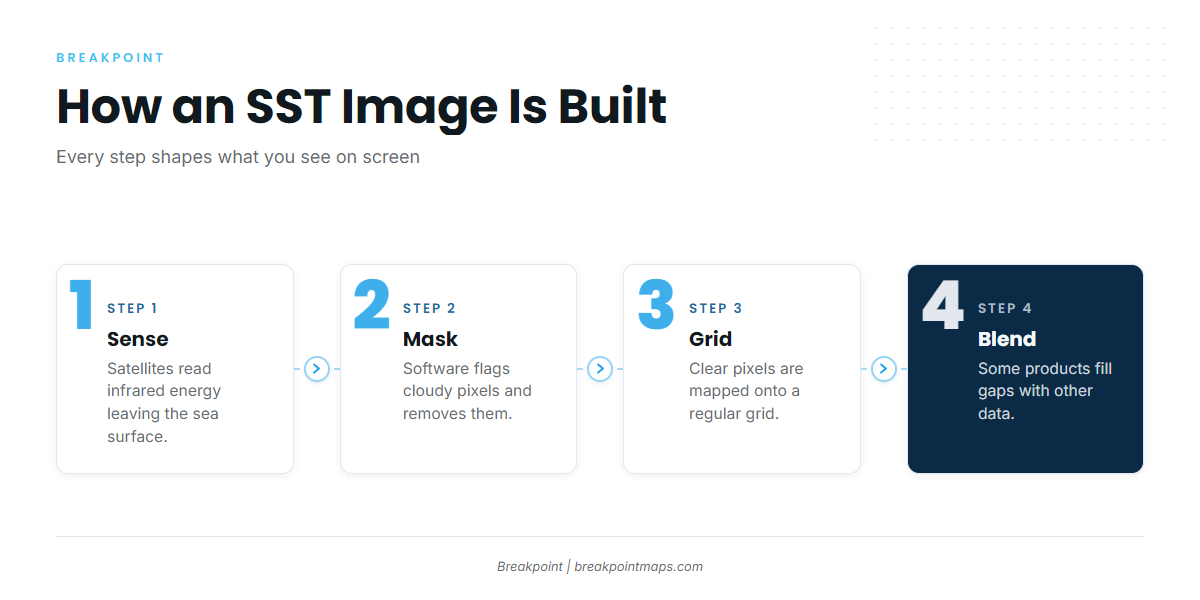
Satellites measure infrared energy leaving the sea surface. Software then screens out cloud, the clear pixels are gridded, and some products fill the gaps with other data. Every step shapes what you see.
The chain runs in this order:
- A sensor reads infrared energy from the water.
- Processing converts that reading to temperature.
- A cloud mask removes pixels it flags as cloudy.
- Clear pixels are placed on a grid.
- Some products blend in other data to fill what’s missing.
Infrared Sensing
Radiometers read infrared radiance from the ocean surface and convert it to temperature. eoPortal describes SST as something measured from space by IR and microwave radiometers.
A pixel is an average over a patch of water, not a point. Infrared also sees only the very top of the water, so the number the satellite reports can differ from what your hull sensor reads.
For the data-curious: NOAA describes the sensor’s reading as the “skin” layer, the upper few micrometers of the sea surface. Temperature deeper in the water, often called “bulk” temperature, can differ from it.
Geostationary vs. Polar Orbit
Two kinds of satellites feed most SST products.
GOES-East and GOES-West sit over one spot and revisit often. They trade some detail for frequency. Polar orbiters carry VIIRS instruments, on NOAA-20 and NOAA-21, among others, and give sharper passes less often. NOAA CoastWatch lists VIIRS SST from NOAA CoastWatch for S-NPP and NOAA-20.
NOAA also runs ACSPO, the Advanced Clear-Sky Processor for Ocean, which is NOAA’s enterprise sea surface temperature system.
| GOES (geostationary) | VIIRS (polar orbit) | |
|---|---|---|
| Orbit | Fixed over one longitude | Passes over the poles |
| Revisit | Every 10 to 15 minutes | Much less often than GOES |
| Nominal resolution | 1 to 4 km (infrared) | 750 m |
| Trade-off | Frequent, coarser | Sharper, less frequent |
For scale, NOAA CoastWatch puts infrared SST resolution at 1 to 4 km and microwave at about 20 to 50 km.
At the dock: check whether you’re looking at frequent, coarse imagery or sharp, occasional imagery.
Cloud Masking
NOAA CoastWatch notes that infrared cannot see through cloud. The processor flags cloudy pixels and removes them, and they show as blank. Gridded L3 and L4 SST products keep those gaps or fill them.
Masks can err in both directions. They can clip valid water at cloud edges, or let cold, cloud-contaminated pixels slip through. Either way, the edge of a blank area is a place to be careful.
Blending and Gap-Filling
Level 4 products are gap-free analyses blending satellite SST from multiple sensors and platforms.
A blended layer works like a best-guess sketch where clouds hid the photo.
| Level | What it is | Gaps and smoothing | Best use |
|---|---|---|---|
| L2 | Individual pass, swath-based | Gaps where clouds were masked | Seeing raw edges from one pass |
| L3 | Passes placed on a regular grid | Gaps remain | Comparing days on a consistent grid |
| L4 | Multi-source merge, gap-filled | No gaps, estimated in places | Big-picture coverage |
At the dock: blank means unknown, and smooth means estimated.
Observed vs. Blended SST: Why the Two Layers Disagree
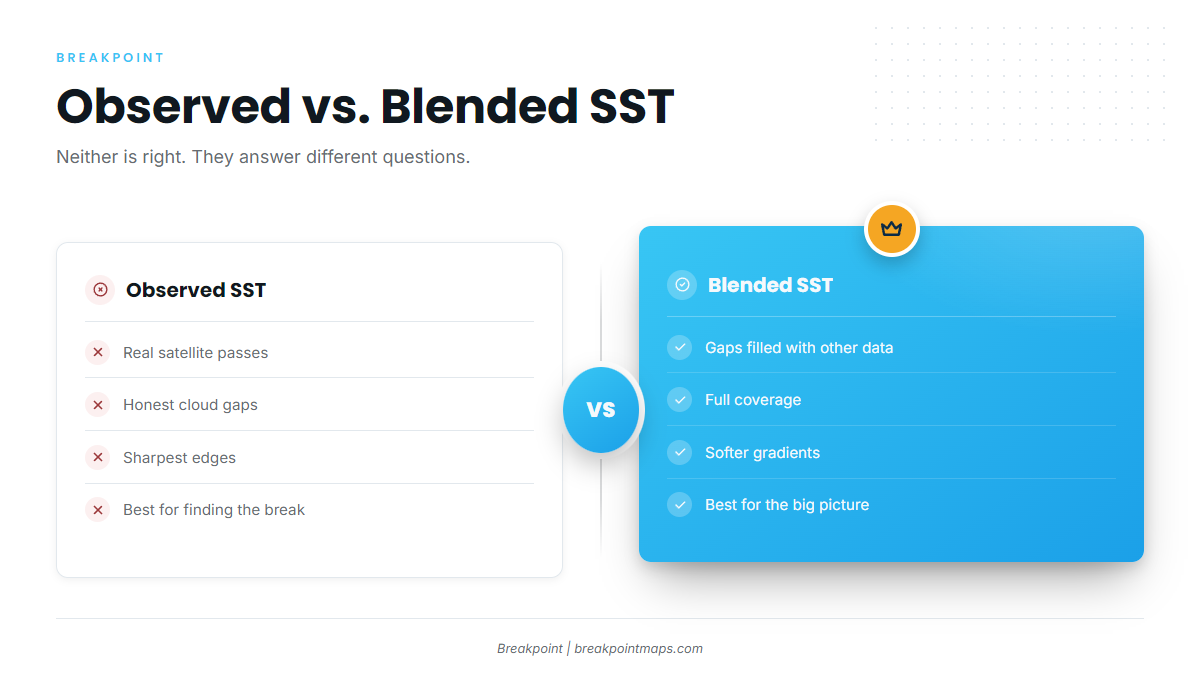
Observed SST shows real passes, with honest cloud gaps and the sharpest edges. Blended SST fills gaps with other data and interpolation, which gives full coverage but softens gradients. Neither is "right"; they answer different questions.
| Observed (OBS SST) | Blended (HD SST) | |
|---|---|---|
| Source | Actual satellite passes | Merged and interpolated inputs |
| Cloud gaps | Yes, shown as blank | Filled |
| Smoothing | Minimal | Yes |
| Timestamp meaning | The 1-day or 3-day composite window | Check the in-app timestamp |
| Best use | Judging edge sharpness | Reading the overall pattern |
A few things follow from this:
- A blended layer can soften a sharp break.
- It can also show a smooth edge where no pass actually saw one.
- Different services use different inputs and blend choices, so the same area can look different from one service to the next.
For when to pick each layer in the app, see OBS SST vs. HD SST: which layer to use.
At the dock: trust observed pixels for the edge, and use blended for the big picture.
Reading the Map: Color Ramps, Sharp Edges and Cloud Artifacts
Cooler water usually appears as blues and greens, and warmer water as yellows through reds. Narrowing the temperature scale to the local range spreads a break across more colors, which makes it easier to see.
A sharp break looks like several color steps packed into a few pixels, while a gradual change looks like wide bands. A pixel is an area, so a "sharp" edge on screen is only as fine as the pixel, and nominal pixel size is not the same as the smallest feature the data can truly resolve.
To tell a real break from an artifact, watch for these:
- An edge that exactly traces the border of a blank cloud gap
- Cold speckle next to cloud
- A feature present in one pass and gone in the next
- Straight lines or seams from compositing
If you see one, confirm with an earlier pass or another layer. These are the same checks behind the temperature-break basics, applied with more attention to how the image was made.
At the dock: if the edge hugs a cloud, treat it as suspect.
How to Read a Temperature Break on an SST Map, Step by Step
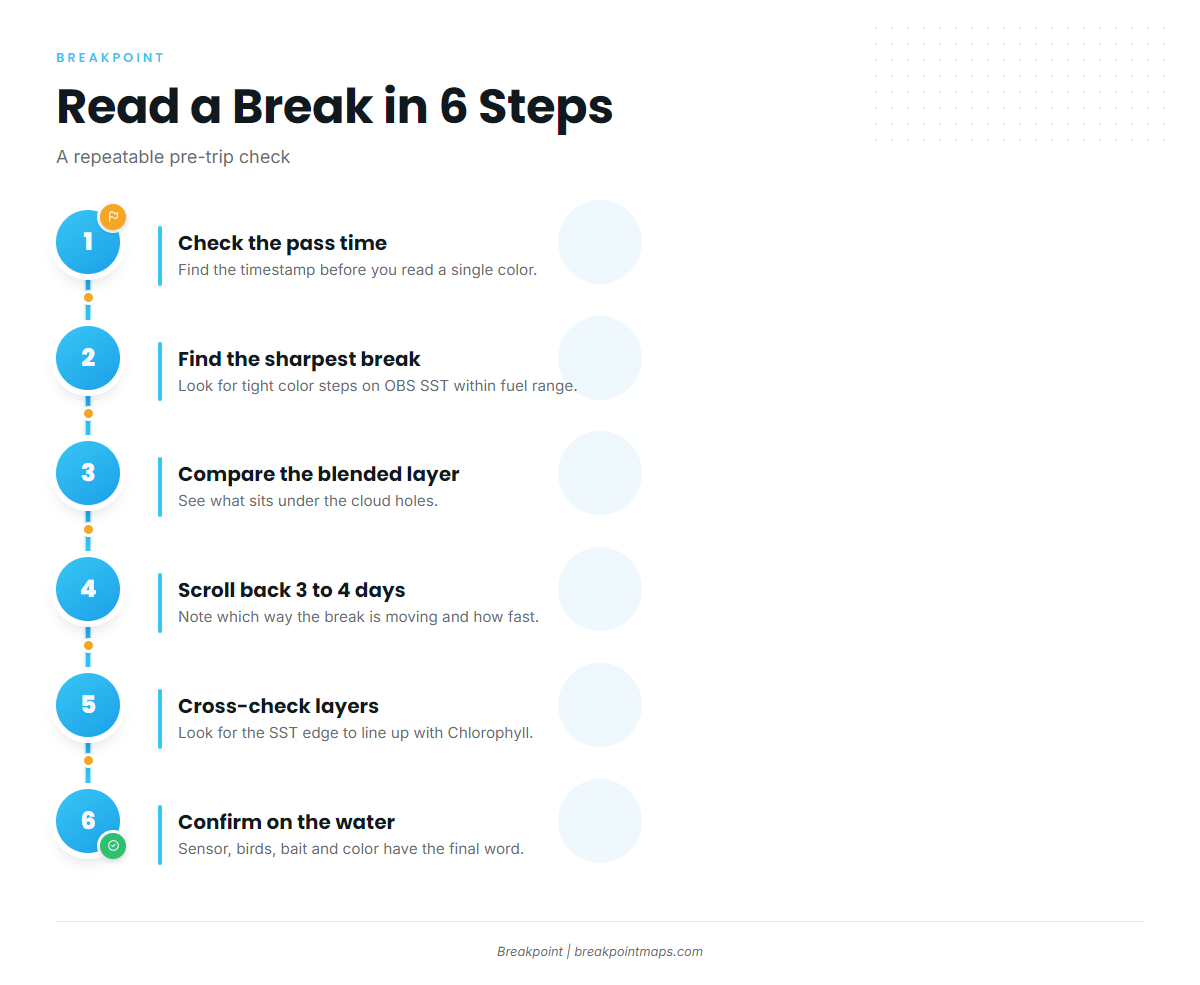
This is the workflow we’d run the night before a trip, in six steps.
1. Check the pass time first
Find the timestamp before you read a single color. BDOutdoors warns that if 24 to 48 hours pass between the snapshot and your arrival, you may troll for "structure that’s long gone."
2. Find the nearest sharp break on OBS SST
Look for the tightest color steps within your fuel range, and weigh distance against sharpness. A slightly softer break you can reach beats a perfect one you can’t.
3. Compare against the blended layer for gaps
Check what sits under the cloud holes, and remember that edges in the blended layer are estimates.
4. Scroll back 3 to 4 days for movement
BDOutdoors recommends looking at three or four days of imagery. Note the direction and speed the break is traveling, then project where it will be when you arrive.
5. Cross-check Chlorophyll and currents or altimetry
Look for the SST edge lining up with a Chlorophyll edge. In The Spread calls a sharp SST break "backed up by a clear sea surface height anomaly" a high-confidence target.
When SST and Chlorophyll disagree, treat that break as lower confidence and rank it lower. Don’t dismiss it, and don’t chase it first.
6. Confirm on the water
Use your sea-temperature sensor, birds, bait marks, weed lines and water color. This is where seamanship takes over, since SST never replaces on-the-water observation.
The whole approach comes down to timestamp, source, movement, cross-check, then confirmation.
Open OBS SST for your area and find the timestamp before you look at a single color.
Confirming the Break on the Water
Your hull sensor reads water at depth, right now. The satellite read the skin, hours ago, so expect some difference. Look for the change in temperature across the edge rather than the absolute number.
A few edge cases to keep in mind:
- Clouds hiding the break. Use the last clear pass, the blended layer and altimetry together.
- Summer surface warming. It can flatten gradients and hide a break that is still there below.
- Eddies. Track them across days, not from one image.
What the Map Can’t See
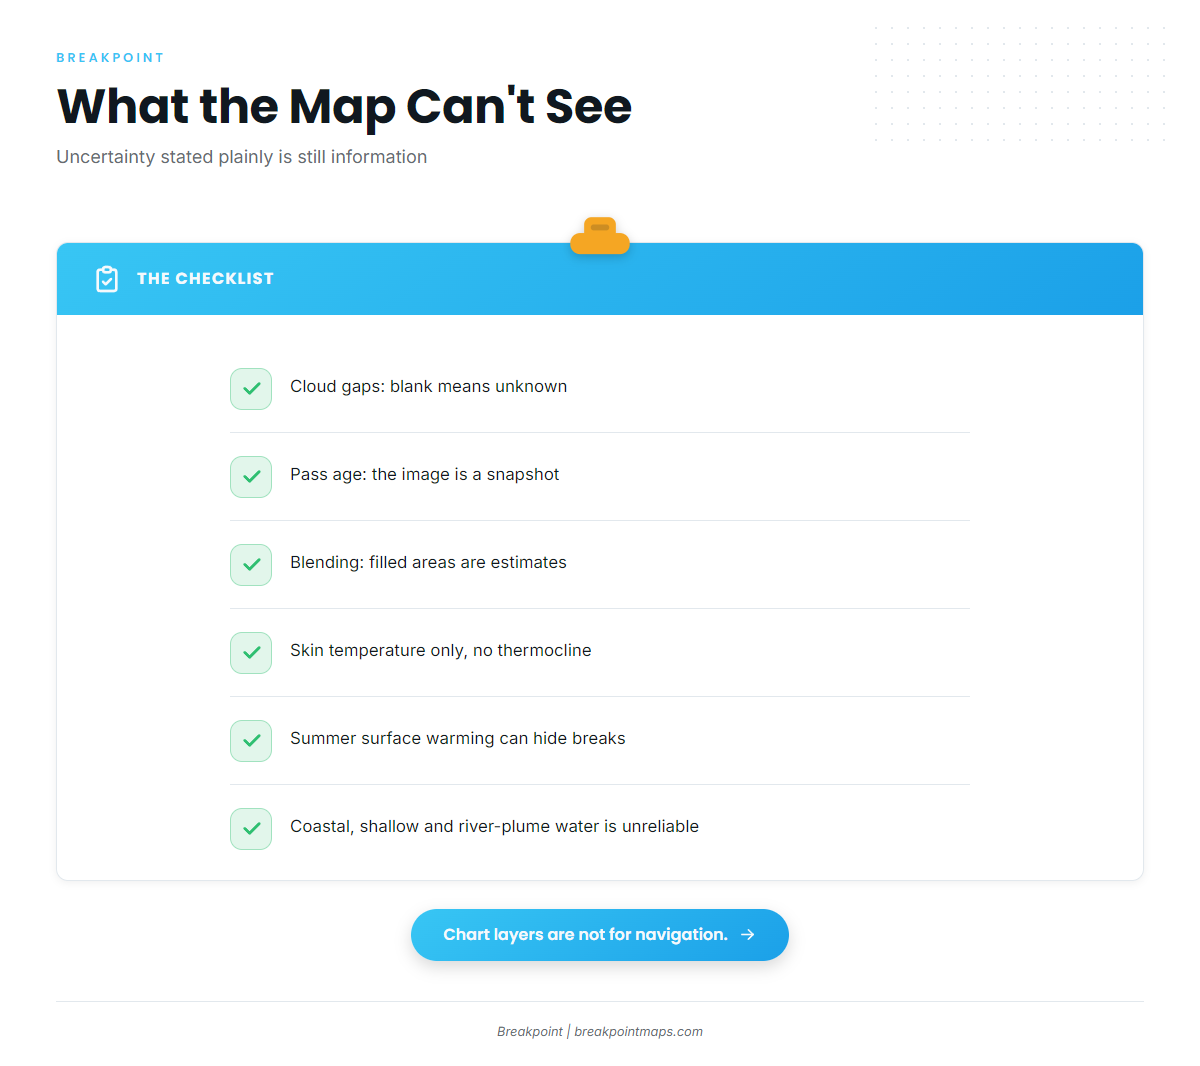
- Cloud gaps. Blank means unknown.
- Pass age. The image is a snapshot.
- Blending smoothness. Filled areas are estimates.
- Skin temperature only. No subsurface structure and no thermocline.
- Summer surface warming. It can hide breaks.
- Coastal, shallow-water and river-plume areas. Reliability drops there.
Stating the uncertainty plainly is still useful information.
Frequently Asked Questions
Why does my SST map have blank areas?
Infrared can’t see through cloud or fog. The processor masks those pixels and removes them rather than guessing. NOAA’s GOES SST product covers only cloud-free pixels over water. Blank means the satellite couldn’t see, not that the water is featureless.
What’s the difference between observed and blended SST?
Observed SST shows real satellite passes, with cloud gaps and sharper edges. Blended SST merges several sources and interpolates the gaps, so it’s complete but smoother. Our OBS SST vs. HD SST post covers when to use each layer in the app.
How old is too old for an SST image?
There’s no fixed cutoff. BDOutdoors warns that 24 to 48 hours between the snapshot and your arrival can leave you chasing structure that’s gone. Scroll back several days to judge how fast a break is moving, and project forward to your arrival time.
Does a temperature break always hold fish?
No. In The Spread notes that a break can hold nothing if Chlorophyll shows barren water. Cross-check Chlorophyll and currents, then confirm on the water. A break raises the odds of a bite but doesn’t promise one.
Can SST see the thermocline?
No. SST measures the surface skin only, so it says nothing about structure below, including the thermocline. Use it to find where surface water changes, then rely on your own sensors and observations for what’s underneath.
How do I tell a real break from a cloud edge?
Warning signs include an edge that traces the border of a blank gap, cold speckle beside cloud, or a feature that vanishes on the next pass. Confirm with an earlier pass or another layer such as Chlorophyll before you commit fuel to it.
Conclusion
Check the timestamp first, and know whether you’re looking at observed or blended data. Distrust edges that hug clouds, cross-check other layers, and let the deck have the final word.
As a one-line checklist: pass time, nearest sharp break, blended comparison, 3 to 4 day movement, Chlorophyll and currents, then confirm on the water. Every step traces back to how NOAA and its partners build the image, from the infrared sensor to the cloud mask to the blend.
Breakpoint puts OBS SST, the blended layer and Chlorophyll on one map so you can run this check at the dock. Chart layers are not for navigation.
None of it replaces the water. It gives you a better decision about where to look.
Data sources: NOAA CoastWatch, NOAA STAR (ACSPO and GOES-R SST), GHRSST, eoPortal, BDOutdoors and In The Spread.