


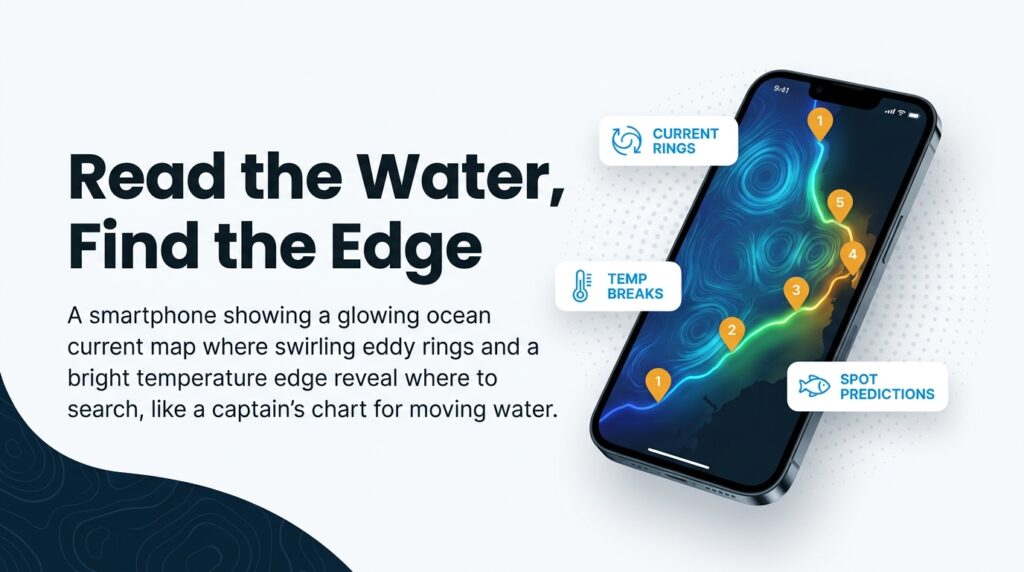
Currents move every day, so last week’s hot spot is often this week’s empty water. Reading ocean currents and eddies for offshore fishing comes down to finding today’s edges rather than memorizing yesterday’s spots. Woods Hole Oceanographic Institution notes that fleets have long wanted to know how and where these features form so they can find fish, and this piece builds on the same layers you can open tonight, including what the satellites cannot see.
By the end, you should be able to open the currents layer, OBS SST and Chlorophyll the night before and make a better decision about where to look. We can’t promise fish, only better water. Below, we cover what eddies are, why edges hold bait, the three big regional systems, a trip-planning workflow, and the limits of the data.
What Currents and Eddies Are
An eddy is a smaller, temporary loop of swirling water that can travel a long way before it dissipates. A gyre is a huge, permanent circulation. According to WHOI, gyres differ from eddies in exactly that way: gyres persist, eddies come and go.
NOAA Fisheries describes eddies as tens to hundreds of miles across, rotating clockwise or counterclockwise. Oceanographers call features at this scale mesoscale. You don’t need the word to fish them, but you’ll see it in the literature.
Southern Boating reports that eddies can last from weeks to more than a year and drift slowly, which is why you check the currents layer for where one sits today.
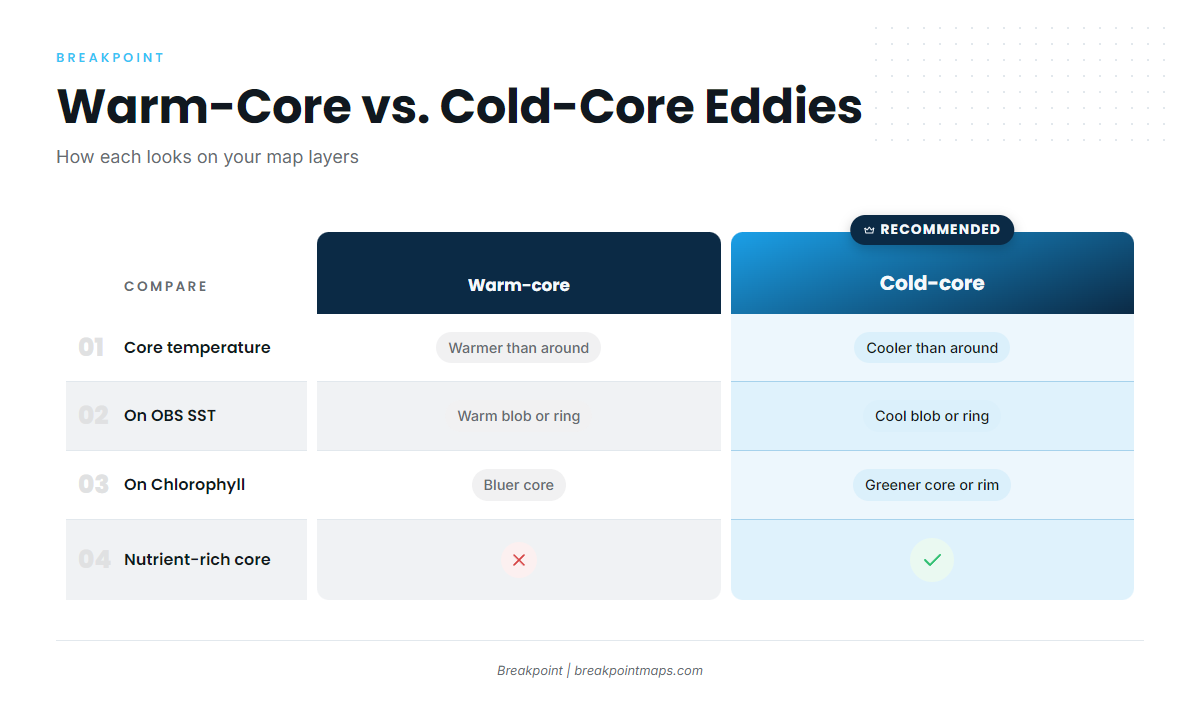
Rotation tells you a lot about what’s inside. In the Northern Hemisphere, cold-core eddies rotate counterclockwise and bring nutrient-rich water up. Warm-core eddies rotate the opposite way and carry warmer, bluer, clearer water. NOAA’s Hawaiʻi study found higher catch rates in clockwise eddies. It was a commercial longline study, not recreational fishing, but it suggests both eddy types can matter.
| Warm-core eddy | Cold-core eddy | |
|---|---|---|
| Rotation (N. Hemisphere) | Clockwise | Counterclockwise |
| Core temperature | Warmer than surrounding water | Cooler than surrounding water |
| Productivity | Clearer, bluer water; NOAA longline study linked clockwise eddies to more prey | Nutrient-rich core; edges draw feeding fish |
| On OBS SST | Warm blob or ring | Cool blob or ring |
| On Chlorophyll | Bluer core | Greener core or rim |
| On the currents layer | Circular arrows around a warm center | Circular arrows around a cool center |
For the data-minded: Eddy life cycles can involve splitting and merging. One eddy on Monday may look like two on Friday. Treat any eddy as a moving, changing target, not a fixed landmark.
Why Current Edges Concentrate Bait and Pelagics
Fish hold on current edges because converging water gathers plankton, weed and bait in one place, and predators follow the food. Where two water masses meet, material gets squeezed into a line, like a seam on a river that collects everything drifting past.
WHOI notes that places where cold water mixes with warm, nutrient-poor water often hold high biomass. The warm-water animals it names at those boundaries include tuna, swordfish and squid. For offshore anglers, that means yellowfin tuna, mahi, wahoo, swordfish and billfish.
Several ingredients stack up at an edge:
- Convergence. Water pushes together and collects weed and bait. Sargassum and weed lines are the visible sign.
- Upwelling. Deep, nutrient-rich water rises and feeds phytoplankton, and the food chain builds from there.
- Temperature break. This is the surface signature of an edge on the SST chart. Our guide on how to read a temperature break on an SST map walks through it.
- Blue-to-green chlorophyll edge. Chlorophyll is a proxy for phytoplankton. Green water means more food and less clarity, and the line between green and blue is often where bait stages.
- Structure. Canyons and the shelf break show up on Chart Contours. Marlin suggests a canyon or seamount under clear, warm water from a western-boundary current is a good place to start searching.
NASA/JPL notes that large fish and marine mammals like to feed near the edges of cold-core eddies, so the rim of an eddy can matter as much as its center.
A single signal is only a hint, while three stacked signals make a plan. BD Outdoors puts it this way: when temperature, chlorophyll and physical structure converge, it’s probably time to mark a waypoint.
The Major Systems by Region
All three systems move. This section describes typical behavior, not fixed positions. Knowing what each system tends to do gives you a starting point, and today’s layer shows where it actually is.
| System | Key features | Typical targets | What to check on today’s layer |
|---|---|---|---|
| Loop Current (Gulf) | Warm flow, shed eddies | yellowfin tuna, billfish, mahi, wahoo | Where the Loop and any detached eddy edges sit today; OBS SST breaks along them |
| Gulf Stream (Atlantic) | Western edge, meanders, filaments, rings | wahoo, mahi, yellowfin tuna, billfish | Where the edge sits relative to Chart Contours; filaments on Chlorophyll |
| California Current (Pacific) | Upwelling, eddies | tuna species | Upwelled cool water, green-to-blue edges, eddy rims |
The Loop Current (Gulf)
The Loop Current is a warm flow that dominates the Gulf and spawns eddies, according to Southern Boating. Those eddies can detach and drift, and each one brings its own edges and its own water color.
Forecasting Loop Current eddies is an active area of research, including eddy forecasting research posted on arXiv. The models are improving, but they are still models. Check the currents layer for where the Loop and its eddies sit today.
For the data-minded: Sea surface height from altimetry shows eddies as raised or lowered sea surface even when cloud hides OBS SST. Warm-core eddies stand higher. Cold-core eddies sit lower.
Gulf Stream Edges (Atlantic)
The Gulf Stream is a warm western boundary current. Its western edge is where the temperature break and current shear tend to concentrate pelagics. Meanders and filaments create extra edges, and rings can pinch off as warm-core or cold-core eddies.
Marlin’s advice is pairing SST with ocean color to spot filaments pushing onto the shelf, the same layering habit used in the workflow below.
If you fish the Outer Banks, our deep dive on wahoo fishing off Cape Hatteras covers the species and the area in detail. The edge moves, so check today’s layer before you pick a canyon.
California Current Eddies (Pacific)
The California Current is a cool Pacific system. Upwelling brings nutrient-rich water toward the surface, and eddies spin off along the way. This section stays general on purpose, so confirm the details for your stretch of coast against the live layers.
Here the task is less about chasing a warm river and more about finding where warm, blue water meets upwelled green water. For a Gulf angler moving to SoCal, that is the biggest shift in how you read the map. Check the currents layer for today’s eddy positions.
How to Read a Currents Map Layer
On a currents layer, arrows show which way the water is going, shading shows relative speed, and circular patterns show eddies. Read those three things in that order, then check the timestamp.
Each element reads as follows:
- Vectors. Arrow direction shows where the water is heading. Arrow length or density shows relative strength.
- Speed shading. Colors show relative strength across the map. Use them to compare one area with another, not to quote a number.
- Rotation. Trace the arrows around a center. Counterclockwise around a cool center suggests a cold-core eddy. Confirm it with OBS SST.
- Freshness. Every layer carries a timestamp. Read it first.
- Resolution. Coarse data can miss small filaments and narrow fronts.
Strong flow changes your spread and your drift, so moderate current is often the more fishable water.
For the data-minded: Model currents are forecasts. Satellite observations are measurements of the past. Trust observations for where things were, and treat the model as a hypothesis for where they are going.
Layering Currents, SST and Chlorophyll: A Trip-Planning Workflow

Run this the night before. Each step adds one signal, and the goal is to find places where several agree.
- Check timestamps on every layer. Note any cloud gaps before you trust what you see.
- Open the currents layer for tonight’s area. Look for edges, convergence and any eddy rotation.
- Read the SST break on OBS SST. Our guide on how to read a temperature break on an SST map covers the method. Then consider choosing a side of the break by your target species’ temperature preference. If one side falls outside the species’ comfort zone, fish tend to travel along the break rather than cross it.
- Overlay Chlorophyll. Find the blue-to-green edge.
- Add Chart Contours. Look for canyons or the shelf break under the edge.
- Mark waypoints where 3 signals stack. Rank them by fuel range and distance.
- Decide go or no-go and set a route. Plan a backup edge in case the first one has moved.
Timing matters. BD Outdoors points out that currents, water masses and chlorophyll are constantly moving, so the gap between when you view the charts and when you arrive offshore can be significant. Check the current layer for today’s position before you fuel up.
For the data-minded: Track one edge over several days. You’ll learn whether it is strengthening, holding or decaying, which tells you how much to trust it.
Confirming the Edge on the Water
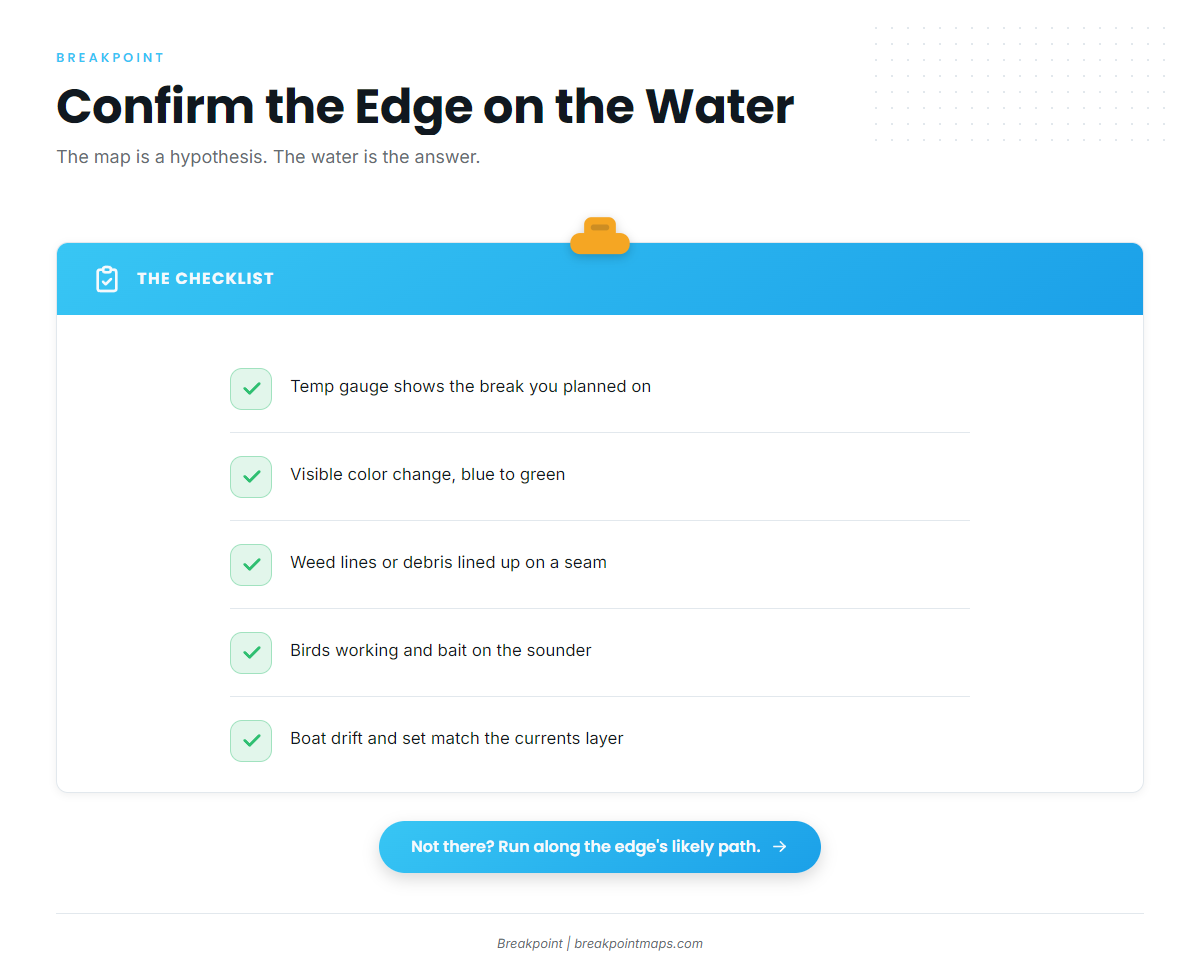
The map is a hypothesis, and the water is the answer. When you reach your waypoint, run this checklist:
- [ ] Temperature gauge shows the break you planned on
- [ ] Visible color change, blue to green
- [ ] Weed lines, sargassum or debris lined up along a seam
- [ ] Birds working and bait on the sounder
- [ ] Drift and set of the boat match the currents layer
If the water is not where the map said, run along the edge’s likely direction of travel and look again.
What the Data Can’t See
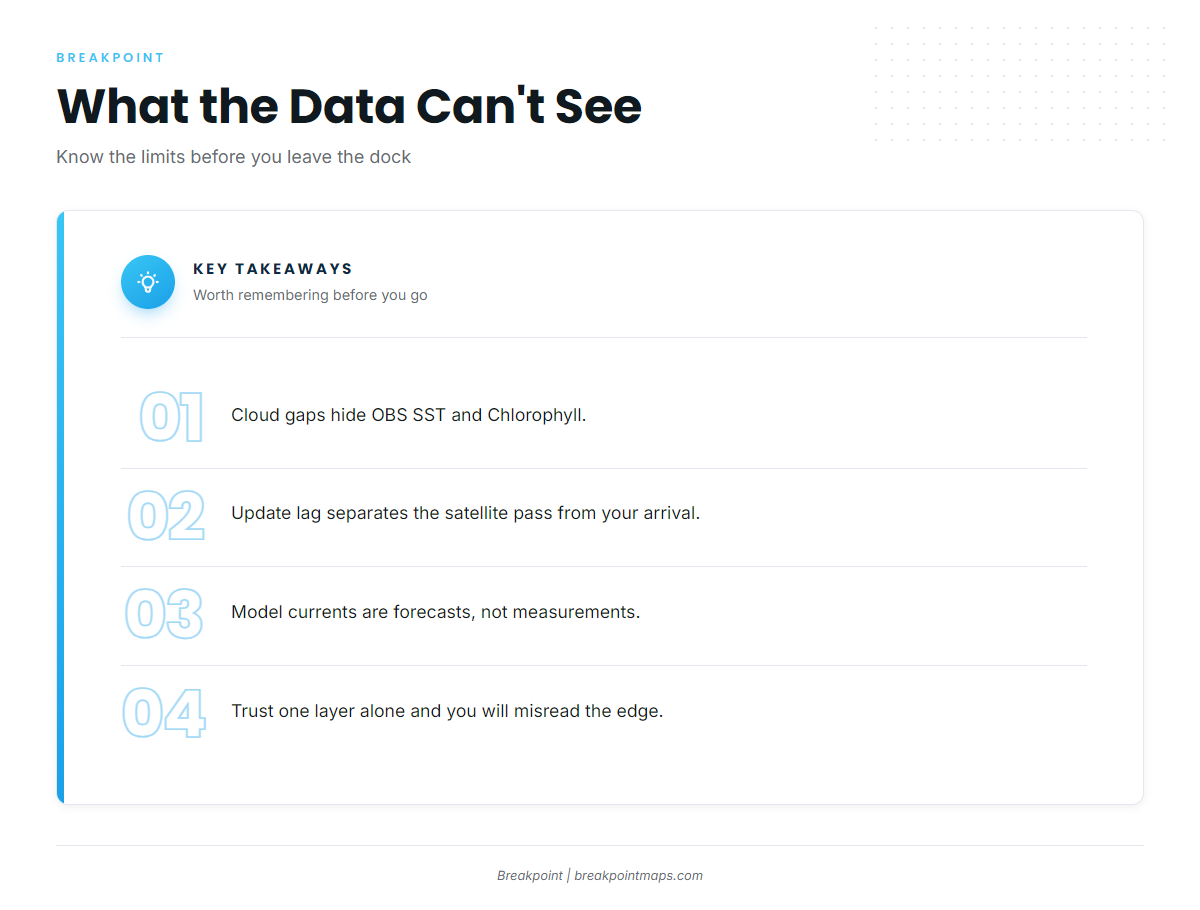
Satellites can’t see through cloud. SST and ocean color both go blank under cloud cover, while altimetry can still reveal eddies through it. That’s why a good plan uses more than one view.
Know these limits before you rely on any layer:
- Cloud gaps in OBS SST and Chlorophyll
- Update lag between the satellite pass and your arrival
- Resolution too coarse for small filaments
- Model currents are forecasts, not measurements
- Some Chart Contours come from old surveys
These are the mistakes we see most often:
- Trusting one layer alone
- Ignoring timestamps
- Treating last week’s spot as fixed
- Reading a cloud edge as a temperature break
As one industry source puts it, conditions shift continuously, so you review fresh imagery rather than lean on historical patterns.
Frequently Asked Questions
What is a warm-core eddy?
A warm-core eddy is a detached ring of warmer, clearer water. In the Northern Hemisphere it rotates clockwise, opposite to a cold-core eddy. NOAA’s Hawaiʻi longline study found higher catch rates in clockwise eddies. That was a commercial study, so treat it as a clue rather than a promise.
What is the Loop Current?
The Loop Current is a warm flow that dominates the Gulf and sheds eddies. Its position changes, and so do the eddies it leaves behind. Check today’s currents layer for where it sits instead of trusting an old map or a fixed coordinate.
Why do fish hold on current edges?
Converging water gathers plankton, weed and bait, and predators follow. WHOI reports that places where cold water mixes with warm, nutrient-poor water often hold high biomass. Tuna, swordfish and squid favor these boundary zones.
What does the blue-to-green chlorophyll transition mean?
It marks the line between clearer, less productive water and green, food-rich water. Chlorophyll is a proxy for phytoplankton. Bait often stages along that line, and predators work it. Confirm the edge on the water with color and temperature.
How fresh does the data need to be?
As fresh as you can get it. Read every timestamp. BD Outdoors notes that the gap between viewing the charts and arriving offshore can vary a lot, and water masses keep moving. Plan a backup edge in case your first choice has shifted.
Can satellites see through clouds?
SST and ocean color cannot, because cloud blocks both. Altimetry, which measures sea surface height, can still detect eddies through cloud. That’s one reason to combine views instead of relying on a single layer.
Conclusion
Currents move, and edges concentrate bait. Stack your signals, confirm on the water, and keep in mind what the data can’t see. The science behind this comes from institutions like WHOI and NOAA, and it’s worth reading in full.
Each night before a run:
- Check the timestamps on every layer.
- Layer the currents layer, OBS SST and Chlorophyll, then add Chart Contours.
- Mark waypoints where 3 signals stack, and pick a backup.
The currents layer shows direction and relative strength of flow, OBS SST shows the temperature breaks, Chlorophyll shows the color edges, and Chart Contours show the structure underneath. Open them together before your next run and read the water for yourself.
Chart layers are not for navigation.