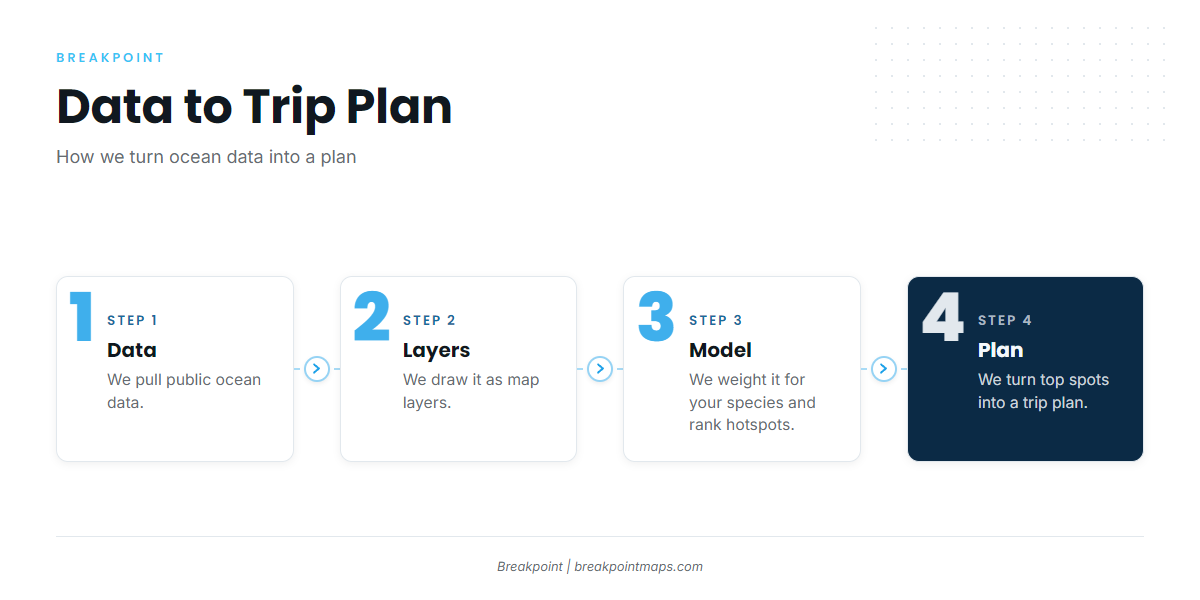



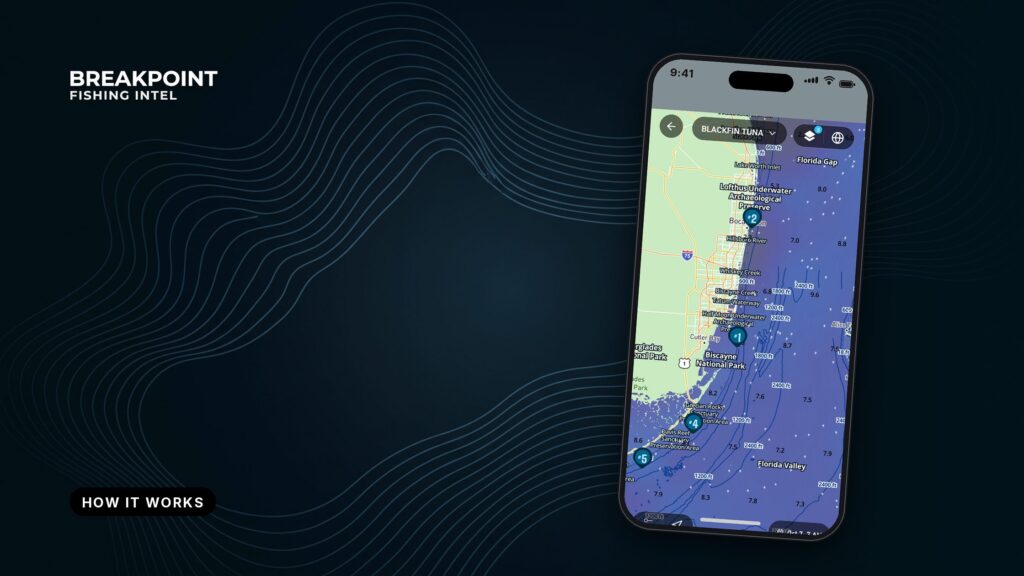
Breakpoint reads the same edges you’d hunt on a chart and ranks them for the fish you’re after. It pulls public ocean data, draws it as map layers, weights the conditions for the species you pick to rank hotspots, and turns the top spots into a trip plan. This page explains how each part works.
Data → layers → model → plan.
We pull public ocean data, draw it as map layers, weight it for your target species to rank hotspots, and turn the top spots into a trip plan.
The data
Satellites and ocean models measure and forecast the sea every day. We collect that data in one place so you don’t have to stitch it together from several sites before a trip.
The inputs come in two kinds:
- Observations. Satellite passes that measure what the water is doing, such as sea surface temperature and chlorophyll.
- Model fields. Forecasts of what the water will do, such as currents, wind and waves.
Sea surface temperature (SST) is the temperature of the top layer of water, measured from space. Most offshore anglers check it first, because temperature breaks hold bait.
Data has an age. Edges move, so a satellite pass from earlier in the day records where the edge was, not necessarily where it is. Check the time stamp on any layer before you commit fuel to it.
The map layers
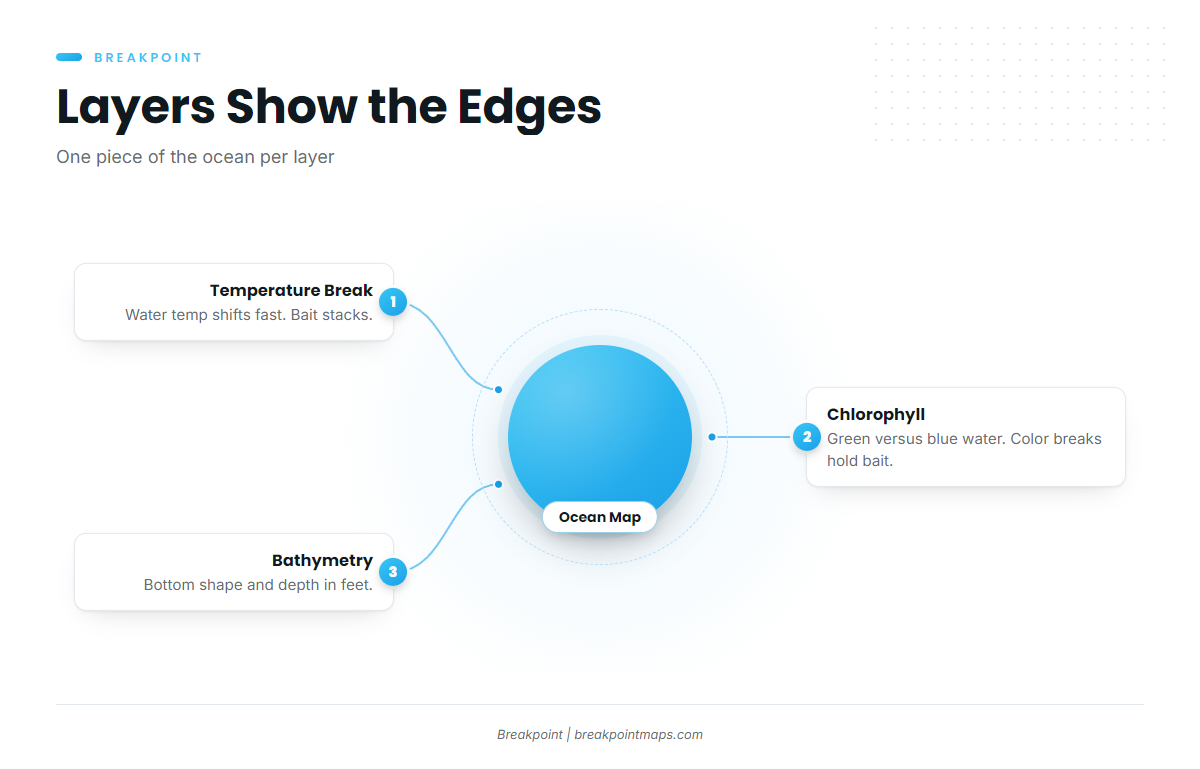
Each layer draws one piece of the ocean so you can see the edges that gather bait. The layer types, and why fish care about each:
- Sea surface temperature. A temperature break is a line where water temperature changes quickly over a short distance. Bait stacks along it, and predators work it. A Gulf Stream wall is the classic example.
- Chlorophyll. Chlorophyll shows plankton, which reads as green water against clean blue. Color breaks hold bait.
- Currents. A current edge is where two bodies of water moving at different speeds or directions meet. An eddy is a spinning ring of water that breaks off a larger current. Both concentrate bait.
- Bathymetry and structure. Bathymetry is the shape and depth of the bottom, in feet on our maps. Canyon edges such as Hudson Canyon and banks such as Stellwagen Bank are where conditions meet structure.
- Wind and waves. These are model forecasts, shown as numbers: wind in knots, wave height in feet, period in seconds.
Chart layers are for fishing reference, not navigation.
Stacked together, these layers show the same edges you’d hunt on a chart, ranked for your target. For the full set, see every layer, what it shows and how to read it.
The species-weighted hotspot model
You pick a species. We weight the conditions that matter to it and rank the water.
Different species respond to different conditions, so the same ocean ranks differently for each one. A pelagic target such as yellowfin tuna or mahi leans on temperature and color edges offshore, while striped bass work a different set of conditions closer in. That difference is the reason for weighting.
The model moves in three steps:
- Inputs. The ocean data and seafloor structure for each patch of water.
- Weighting. Each condition counts more or less depending on the species you chose.
- Ranking. The combined result puts the best-scoring places at the top.
A hotspot score ranks conditions against what a species favors. It doesn’t count fish and it can’t see them. It tells you where to look first.
From hotspot to trip plan
A ranked hotspot is a place to look. A plan adds the day, the run and the backup.
A trip plan comes together in a few steps:
- Pick a target species and a date window.
- Review the top-ranked spots.
- Compare the run distance for each.
- Check the wind and wave numbers, for example wind 15 knots, seas 4 feet at 7 seconds.
- Choose a fallback spot.
When two spots score close, run distance and the forecast usually break the tie. If you’re planning days ahead around a weather window, the numbers show which spots stay in reach. Then confirm against the official marine forecast.
For a step-by-step walkthrough, see how to plan a fishing trip with Breakpoint.
Where Breakpoint fits among fishing apps
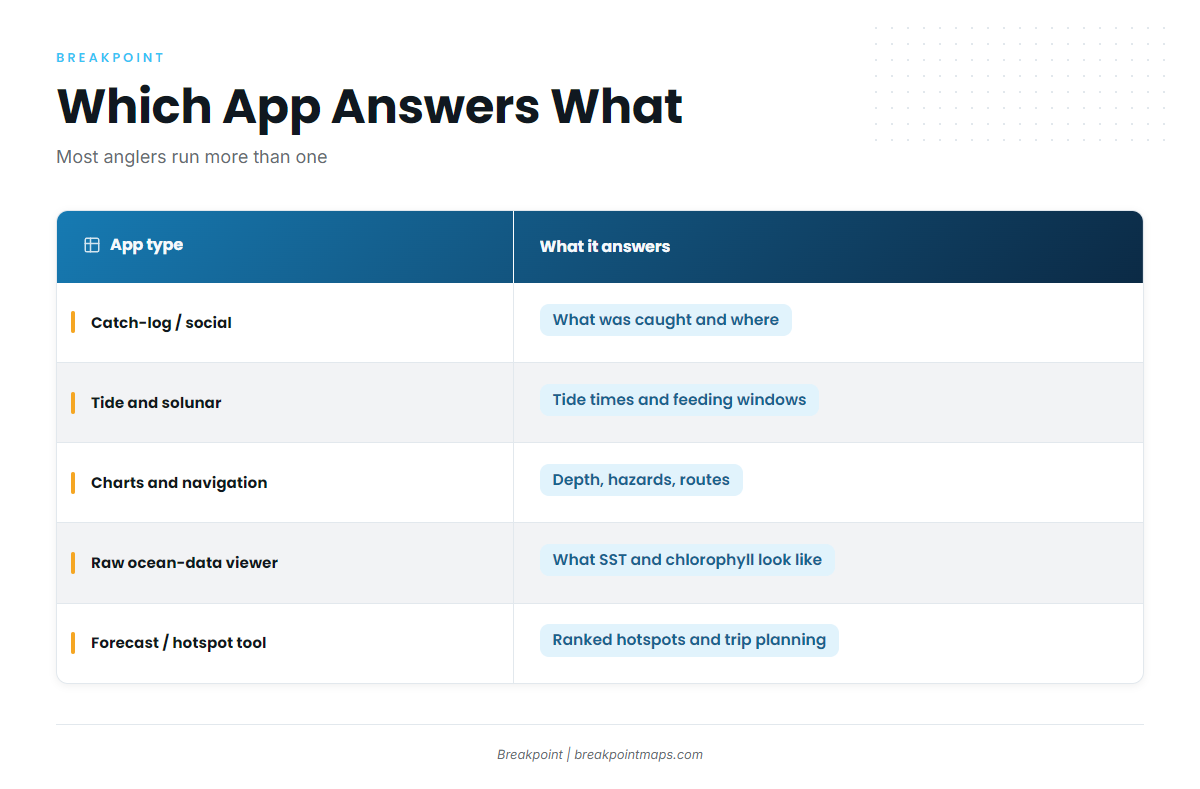
Each type of app answers a different question, and most anglers run more than one.
| App type | What it answers | What it does not | Best paired with |
|---|---|---|---|
| Catch-log and social apps | What you and others caught, and where | Present ocean conditions | A forecast tool |
| Tide and solunar apps | Tide times and moon-based feeding windows | Offshore temperature or color edges | An ocean-data tool |
| Charts and navigation apps | Depth, hazards, routes | Where bait and predators sit | A forecast tool, plus official charts |
| Raw ocean-data viewers | What SST and chlorophyll look like | Which spot ranks best for your species | Your own chart-reading time |
| Forecast and hotspot tools (Breakpoint) | Ranked hotspots for a chosen species, and a trip plan | Navigation, official forecasts, regulations | Official marine forecast, nautical charts, seamanship |
Raw viewers show the picture. Breakpoint adds the ranking and the plan on top of it.
What Breakpoint does not do
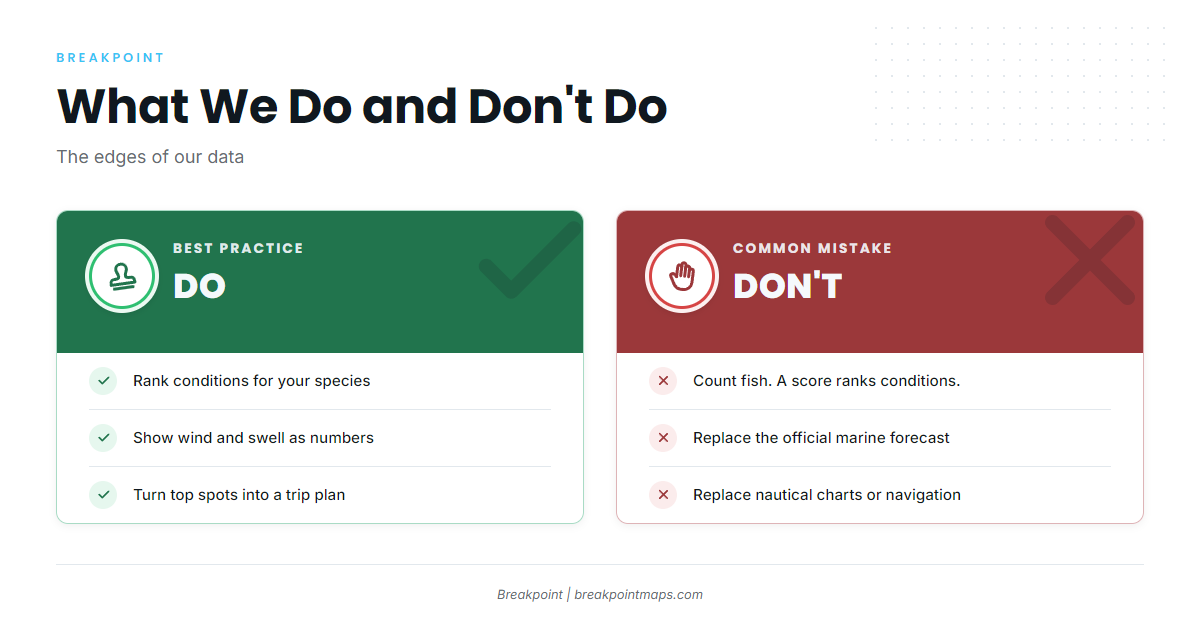
The data has limits, and so does the app. Here is where they are.
What the data cannot see
- Cloud. Cloud blocks satellite SST and chlorophyll passes, so under cloud there is no fresh reading.
- Forecasts. Model fields are forecasts, not measurements.
- Age. Every pass has a time stamp. For refresh timing, use the FAQ wording above.
- Fish. A hotspot score ranks conditions. It does not count fish.
What Breakpoint does not replace
- Official marine forecasts. We give wind, wave height and period as numbers. The forecast to rely on for the trip is the official one, such as the NWS Coastal Waters Forecast for Monterey Bay.
- Bar and inlet conditions. Where official live views exist, they outrank any app. At La Push, Washington, the NWS bar camera page shows the Quillayute River bar.
- Nautical charts and pilot guides. Chart layers in the app are not for navigation. Read the NOAA U.S. Coast Pilot chapter for your waters, and run official charts.
- Seamanship. The skipper makes the go or no-go call. We never call conditions safe, rough or calm. We give you the numbers.
- Regulations. Check the agency’s page before fishing.
Where to go next
- You already read SST and chlorophyll and want specifics: every layer, what it shows and how to read it.
- You have a target species and a weather window: plan a fishing trip with Breakpoint.
- You want to look at your own water: download Breakpoint from the App Store or Google Play and open your region.
Breakpoint gives you a better read on where to look. The water still decides the day.
FAQ
How does the hotspot score work?
You choose a species. We weight the conditions it favors and rank the water, so the best-scoring places rise to the top. The score ranks conditions against what that species favors. It does not count fish, and it is guidance on where to look first.
Can clouds affect the data?
Yes. Cloud blocks satellite SST and chlorophyll passes, so the latest reading under cloud may be older than you expect. Check the time stamp on the layer. Model fields such as wind and waves are forecasts, not measurements.
Does Breakpoint replace a marine forecast or chart?
No. Check the official NWS marine forecast and official charts before you go. Chart layers in the app are not for navigation. Seamanship and the skipper’s judgment decide the trip, and we give wind, wave height and period as numbers only.
What type of fishing app is Breakpoint?
It is a forecast and hotspot tool built on public ocean data. It adds species ranking and trip planning on top of the map layers. It sits alongside catch logs, tide apps and charts, and it does not replace the official forecast or your charts.
What does a temperature break mean for where I fish?
A temperature break is a line where water temperature changes quickly over a short distance. Bait stacks along it and predators work it. On the map it appears as a tight band on the SST layer, which is where the ranking tends to start.