




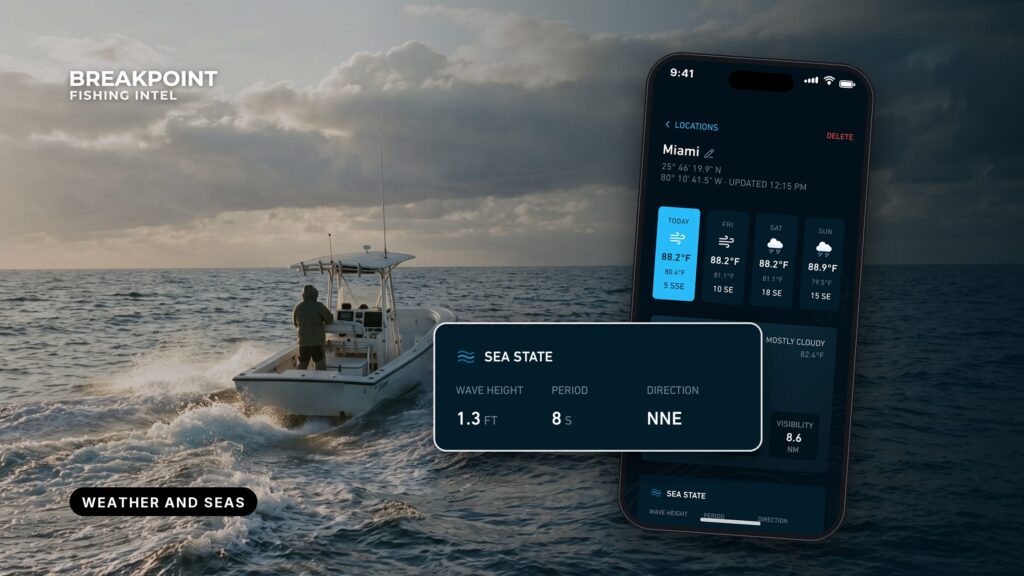
Not for navigation. Breakpoint charts are for trip planning. Navigate with official charts and your vessel’s instruments.
This is a reference for the numbers to check before an offshore run and what each one means on the water. It covers the physics and decodes the forecast wording, so you can read seas, period, gusts, swell direction and inlet current timing without guessing. The forecast for your zone makes the call, so check the NWS marine forecast before every trip.
Guides in this series
Every guide on this page, grouped by what it covers.
Forecasts and sea state
- Reading wind and wave forecasts – reading wind and wave forecasts for an offshore run.
Observations: buoys and stations
- Tide stations and buoy data – using NDBC buoys and CO-OPS stations before and during a trip.
Tides, moon and data
- Solunar tables explainedwhat solunar tables calculate and what they cannot tell you.
- Ocean data for anglersthe wider set of ocean data layers.
The handful of numbers to check
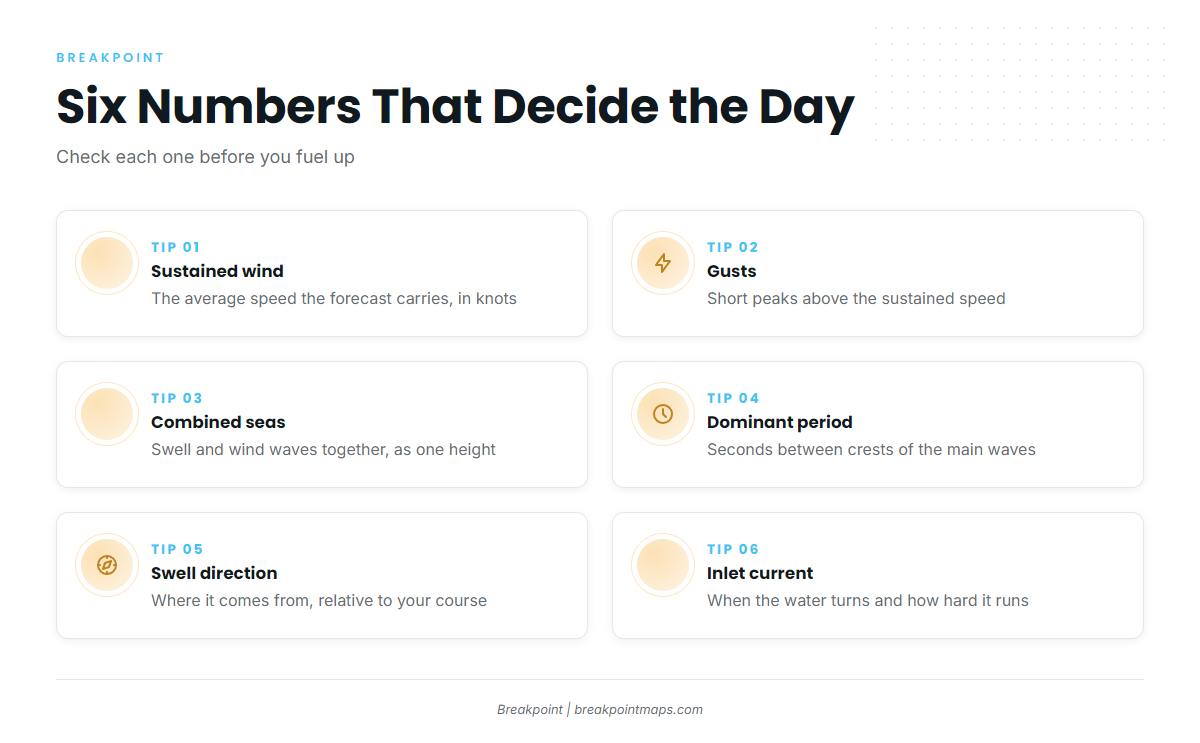
Before an offshore run, six numbers describe the day:
- Sustained wind: the average speed the forecast carries, in knots, taken over a span of minutes.
- Gusts: the short peaks above the sustained speed. The forecast prints both because sustained wind is the steady push that builds seas, while gusts are the peaks you feel at the helm.
- Combined seas: the significant wave height of swell and wind waves together.
- Dominant period: the seconds between crests of the waves carrying the most energy.
- Swell direction: where the swell comes from, relative to your course out and back.
- Tide and current timing at your inlet: when the water turns and how hard it runs.
Each item maps to a forecast term or a buoy field covered below. The numbers come from the NWS forecast for your zone, the nearest NDBC buoy and the CO-OPS station.
Reading the marine forecast
An NWS marine forecast is the official text forecast of wind, seas and weather for a defined forecast zone, issued by the local NWS office.
App and model output is not the NWS forecast. Many apps draw on wave models such as WaveWatch III, and a model grid cell is not a forecaster’s call for a zone. Use the app as a second look and the zone forecast as the source.
| Forecast element | What it tells you | Where else to read it |
|---|---|---|
| Wind and gusts | Direction, sustained range, peaks | Nearest NDBC buoy (WSPD, GST) |
| Seas | Significant wave height, a range | NDBC buoy (WVHT) |
| Wave Detail | Direction, height and period of each component | NDBC buoy (DPD, MWD) |
| Headlines | Advisories and warnings for the zone | NOAA Weather Radio |
Coastal and offshore zones
Coastal waters zones run out a set distance from shore, and offshore waters zones begin where coastal zones end. A canyon run crosses both.
Off Ocean City, Maryland, the inshore zone is ANZ650 and the offshore zone is ANZ820. The canyons start about 60 miles out, so the run out and back reads two forecasts.
Zones are split differently from office to office. The Houston/Galveston office divides coastal waters into out 20 NM and 20 to 60 NM. Off Pensacola, Pensacola coastal waters zone GMZ655 runs out 20 NM.
Each zone has a code (ANZ, GMZ and so on), and the code is how you confirm you are reading the right box.
Headlines: Small Craft Advisory, Gale, Storm, Hurricane Force
A headline is a product the NWS issues when forecast wind or seas reach set criteria. Small Craft Advisory, Gale Warning, Storm Warning and Hurricane Force Wind Warning are wind-speed categories, each stepping up from the one before. Small Craft Advisory criteria vary by NWS office, so the office page and your zone forecast are where to read the local definition.
Decoding an example forecast line
Illustrative format, not a live forecast.
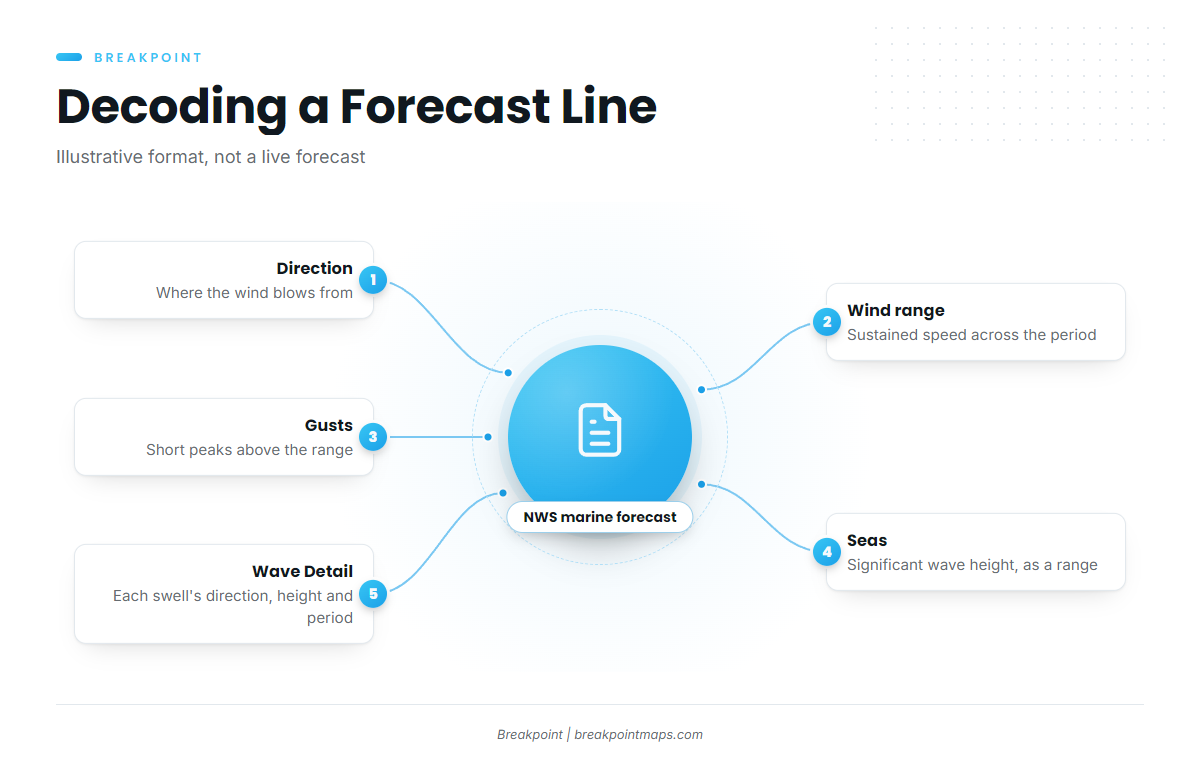
SW winds 15 to 20 kt with gusts up to 25 kt. Seas 4 to 6 ft. Wave Detail: S 5 ft at 7 seconds and SE 2 ft at 11 seconds.
- Direction: wind direction is where the wind blows from.
- Wind range: "15 to 20 kt" is the sustained range across the forecast period.
- Gusts: the peaks above that range.
- Seas: "Seas 4 to 6 ft" is significant wave height, a range over the forecast period and zone.
- Wave Detail: splits the seas into components, each with its own direction, height and period.
Read the coastal or offshore waters forecast for your zone code, and use NOAA Weather Radio or VHF weather channels underway.
Waves, period and swell
Wave period is the time in seconds between successive crests. At the same height, a shorter period means steeper, more closely spaced waves.
Height alone does not describe the ride. The guide to reading wind and wave forecasts walks through pairing height with period on a real forecast.
How wind makes waves
Wave growth depends on three things:
- Wind speed: stronger wind transfers more energy to the water.
- Duration: how long the wind keeps blowing.
- Fetch: the open-water distance the wind blows over.
That is why seas build through a day of steady wind.
Wind waves and swell
Wind waves are generated locally, with a short period and a disorganized look. Swell is generated elsewhere and travels out of its generating area, with a longer period and a more organized look. Both can be present at once from different directions, which is what combined seas and Wave Detail describe.
Significant wave height
Significant wave height is the average height of the highest one-third of waves. It is a statistical average, so individual waves run larger than the number printed.
Period and steepness
A longer period means a longer wavelength, and at the same height a longer wavelength gives gentler faces. Steepness, the height relative to the wavelength, is what the hull feels. The forecast and buoys report dominant and average period, defined in the buoy section below.
Direction relative to course
A head sea meets the bow, a beam sea meets the side, and a following sea comes from astern. The run out and the run home meet the same swell from opposite sides.
Check Wave Detail in the NWS zone forecast and the dominant period and wave direction on the nearest NDBC buoy.
Wind against current and inlets
When current runs against the direction waves travel, wavelength shortens and faces steepen. That is why an ebb meeting onshore swell makes waves stand up on an inlet bar. Ebb flow is strongest where it is constricted, as at inlets and jetties, and the shallow water over the bar steepens waves further.
- Hatteras Inlet: the bar shifts continually, and the buoys over it are moved often and are not charted. Tidal current reaches about 2 knots and is influenced by wind. The details are in Coast Pilot 4, Chapter 4, and the Coast Guard port status notices list the inlet with frequent shoaling and shifting bottoms. The offshore reference is NDBC 41025, Diamond Shoals.
- Galveston jetties: between the jetties the current averages about 1.7 knots on the flood and 2.3 knots on the ebb at strength. East or southeast winds can hold a flood for a day or more, and west or northwest winds can hold an outgoing current. Offshore observations come from NDBC Station 42035 observations.
- Ocean City Inlet: the Coast Pilot describes a strong ebb within the inlet, and currents of as much as 3 knots occur at times in the strongest parts of inlets on this coast.
- Pensacola Caucus Cut: the ebb runs about 2 to 2.5 knots for roughly 2 hours at strength. The offshore references are NDBC 42012 and zone GMZ655.
Check the CO-OPS current predictions for your inlet, the NWS zone forecast and the Coast Pilot chapter for your entrance.
Tide predictions versus current predictions
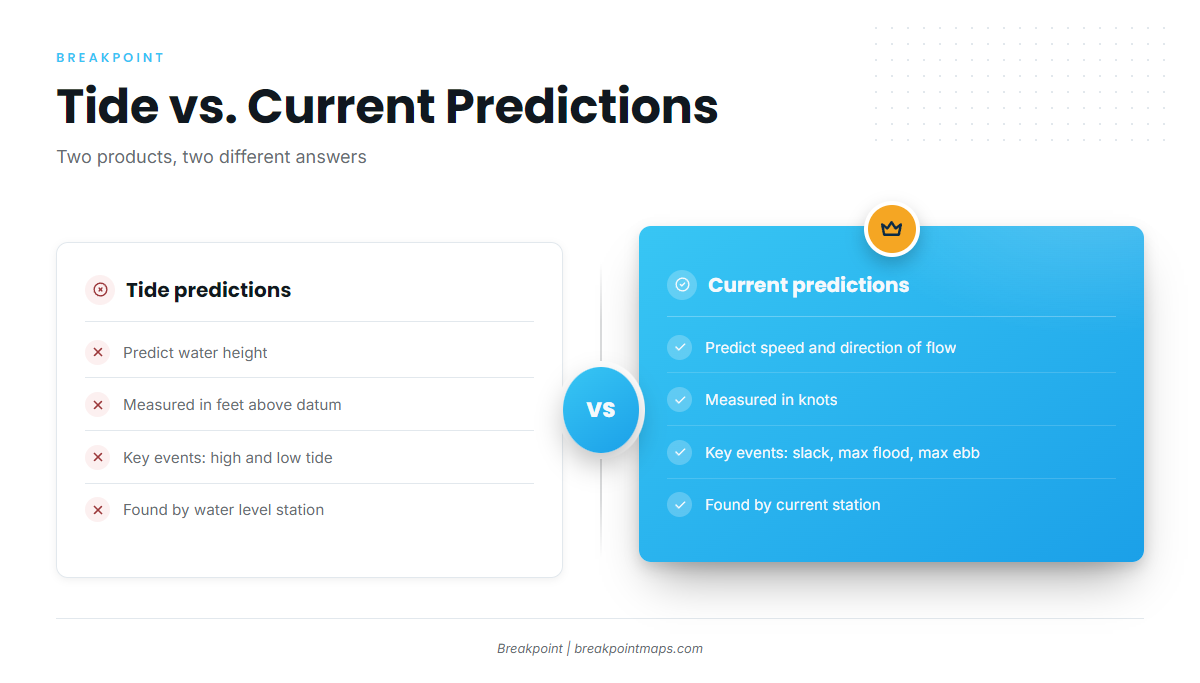
A tide prediction gives the height of the water, and a current prediction gives the speed and direction the water moves. They are separate products, and their key times often differ.
- Flood: incoming current.
- Ebb: outgoing current.
- Slack: the brief period of little or no current around the turn.
Slack often misses high or low tide because the basin behind the inlet keeps filling or draining after the outside water peaks. Larger tidal range near new and full moon gives stronger currents, and neap tides give weaker ones. Solunar times are a separate matter: they are astronomical calculations of moon and sun position, and what solunar tables calculate is not current.
Predictions are astronomical, so wind and surge move observed water off prediction. A norther can lower Galveston Bay by as much as 3 feet, and sustained onshore winds can hold a flood running for a day or more.
| Product | What it predicts | Units | Key events | Where on CO-OPS |
|---|---|---|---|---|
| Tide predictions | Water height above chart datum | feet | High and low tide | Tides & Currents tide predictions, by water level station |
| Current predictions | Speed and direction of flow | knots | Slack, max flood, max ebb | Tides & Currents current predictions, by current station |
Swipe the table sideways to see every column.
Check NOAA CO-OPS Tides & Currents for the current station nearest your inlet, then the water level station for observed versus predicted.
What buoys and stations report
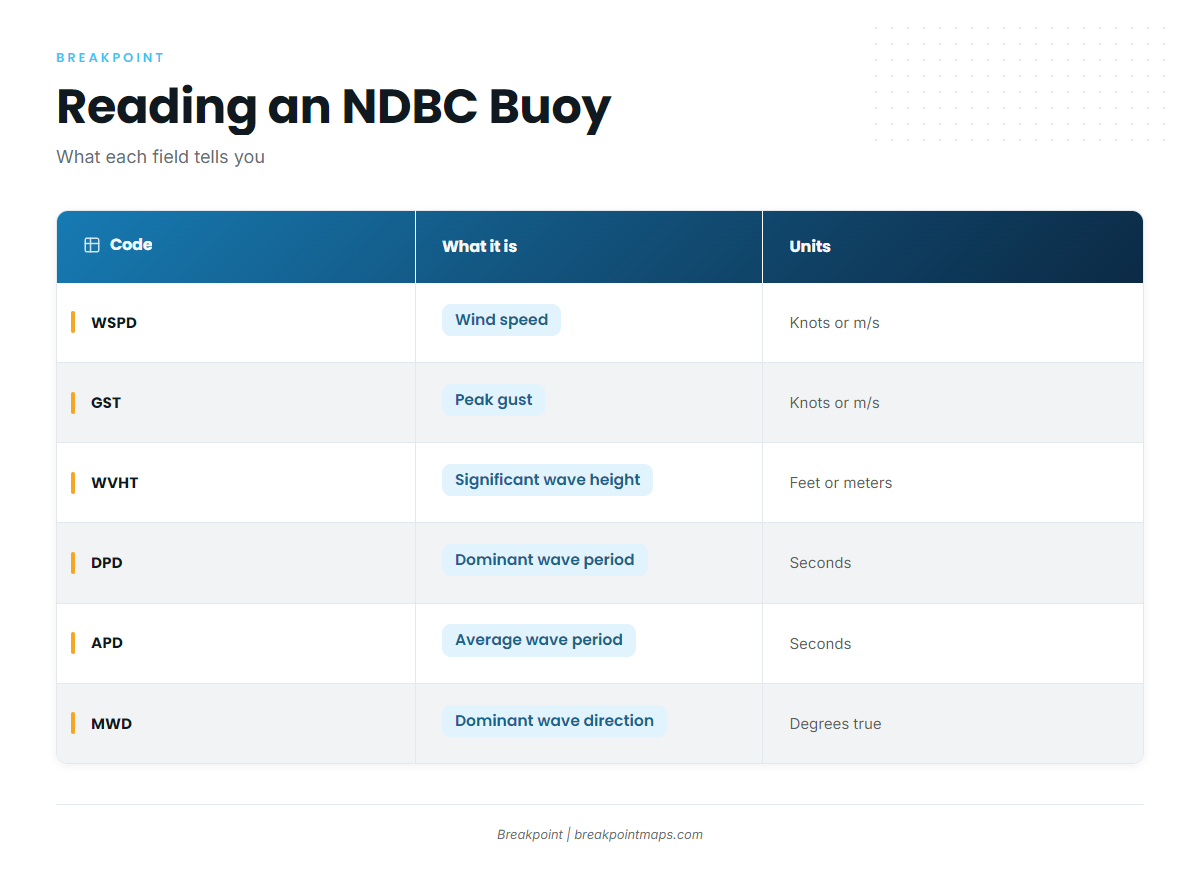
An NDBC buoy reports observed wind, waves and weather at one point, and a CO-OPS station reports observed water level or current at one point. The observation shows what is happening there, and the forecast says what is expected across the zone. The guide on using NDBC buoys and CO-OPS stations covers reading them before and during a trip.
| Code | What it is | Units |
|---|---|---|
| WSPD | Wind speed averaged over the station’s sampling period | m/s in data files; station pages can display knots |
| GST | Peak gust during the sampling period | same as WSPD |
| WVHT | Significant wave height | meters in files; feet on display |
| DPD | Dominant wave period, the period of the waves with the most energy | seconds |
| APD | Average period of all waves in the record | seconds |
| MWD | Direction the dominant-period waves come from | degrees true |
DPD can show a long-period swell while APD reflects shorter wind waves riding on it, so reading both reveals a mixed sea.
Buoys also report pressure, which shows change over time, and water temperature. Named stations along the coast include 41025 Diamond Shoals, 42035 (22 NM east of Galveston), 42012 Orange Beach and OCIM2 Ocean City.
Check the nearest NDBC station page and the CO-OPS station for your inlet, then read them against the NWS zone forecast.
From buoy numbers to the chart
Seas are read with period and direction. Inlets are read with current rather than tide height.
Buoy water temperature is a single point. The guide to ocean data for anglers covers the layers that map it across the water, such as OBS SST and Chlorophyll. Chart layers are not for navigation, so check the NWS forecast for your zone before every run.