




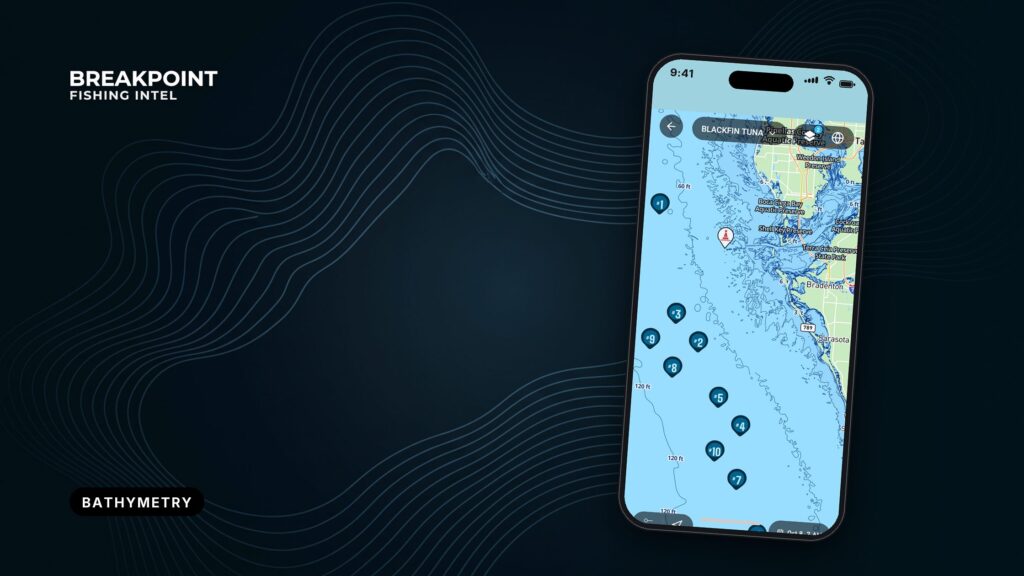
Not for navigation. Breakpoint charts are for trip planning. Navigate with official charts and your vessel’s instruments.
A contour line joins points of equal depth. The spacing between lines shows how fast the bottom changes, and fish that live on structure tend to sit where it changes fastest.
If you can read the contours and know the contour interval, a chart will tell you where to start looking before you leave the dock. It works like a hiking map with the numbers running downward. It helps you decide where to look and doesn’t promise fish. This guide covers the interval, line spacing, humps and ledges, why fish hold on breaks, what the MLLW number means, and what contours miss.
What a contour line shows
A depth contour, or isobath, connects points of equal depth. Bathymetry is the measurement of bottom shape, and contours are how that shape gets drawn on a map. The lines are built from soundings, the spot depths measured by survey vessels.
Contour lines never cross. Each line closes on itself somewhere, even if it closes off the edge of your screen.
- A line is a depth. Every point on it sits at the same depth.
- Spacing is slope. The distance between two lines shows how quickly the bottom rises or falls.
- Shape is structure. A bend, a ring or a pinch in a line marks a feature on the bottom.
Each line is a depth you can follow with the boat, and its shape is the shape of the edge you will fish.
Contour interval sets the detail
The contour interval is the depth difference between two neighboring contour lines. A 10-unit interval puts a line at every 10 units of depth. A smaller interval shows more of the bottom, while a larger one smooths over features that fall between lines.
How to find the interval
- Check the legend or chart margin. Most maps state the interval outright.
- Subtract the labels on two adjacent lines. If there is no legend, the difference is the interval.
- Confirm the units. Depths are in feet, meters or fathoms, and mixing them up shifts every conclusion you draw.
The interval can change on the same map
One map can use several intervals. The NOAA Fisheries InPort contour record draws lines every 10 m from 0 to 100 m, every 25 m from 100 to 500 m, and every 100 m beyond that. Detail is finest in shallow water and coarsest in the deep.
Interval can also change with zoom. The NOAA NCEI GEBCO contour service uses 500 m, 1,000 m and 2,000 m intervals as the scale gets smaller. A 500 m interval cannot show a ledge that rises 20 feet. Zoomed-out or global contours tell you where the shelf break runs, not where the fishable ledge sits.
The interval hides structure
A ledge or hump with less relief than the interval can sit entirely between two lines and never appear. Check the interval before you decide a stretch of bottom is featureless, because a blank patch on a coarse map is not proof of flat bottom.
Tight lines and wide lines
Tight contour lines mean the depth changes quickly over a short distance, which marks a steep slope, drop-off or breakline. Wide lines mean flat or gently sloping bottom. Stacked or merged lines mean a ledge or wall. Evenly spaced lines usually mean a smooth slope rather than a series of steps, since each line marks a depth and not a stair tread.
"Tight" is relative to the interval. Five lines close together on a 2-foot interval show less relief than five lines close together on a 10-foot interval, so read the spacing and the interval together.
| Spacing | Bottom | Where to look |
|---|---|---|
| Tight | Steep slope or drop-off | The breakline |
| Wide | Flat or gentle slope | Move on unless something else draws you |
| Stacked or merged | Ledge or wall | The lip and the base |
Start the search where spacing tightens. That is the breakline, and it is the first edge to mark.
Humps, ledges, points and saddles
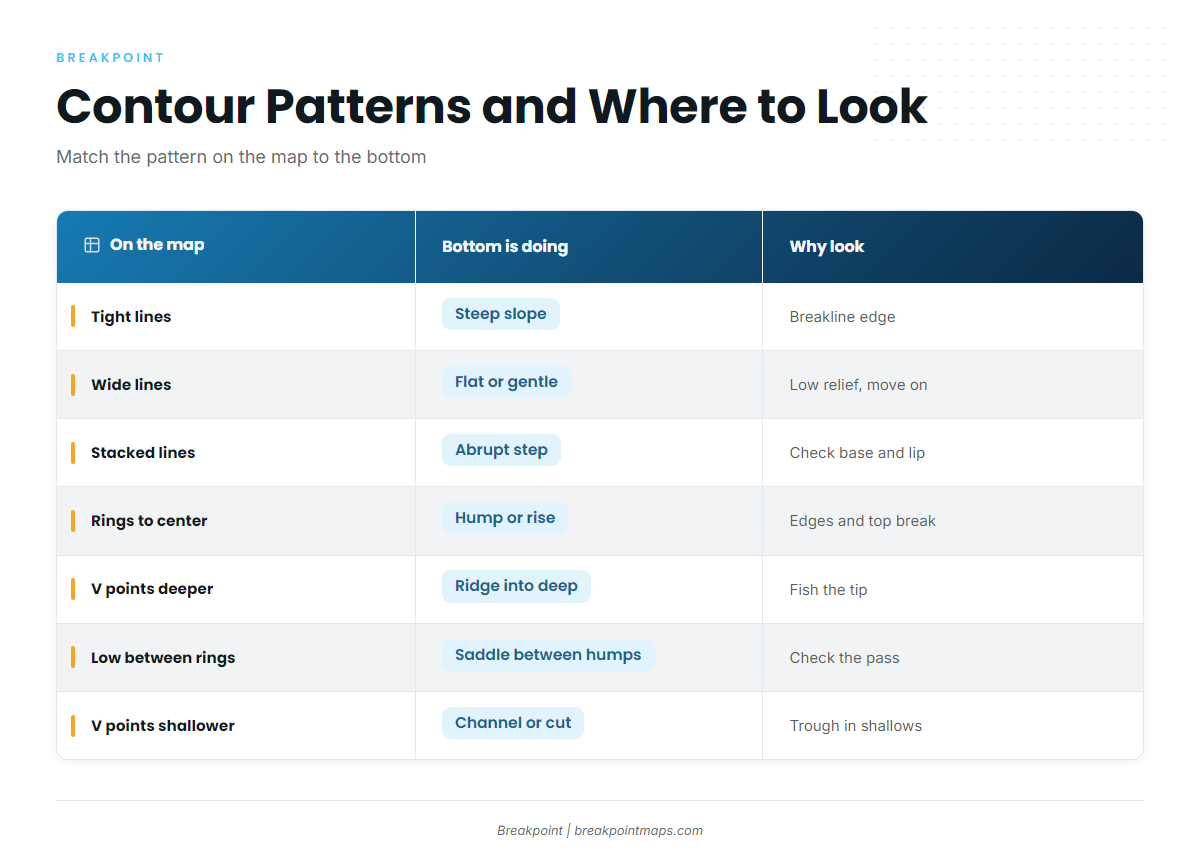
Each feature has a signature on the map. Learn the pattern, then ask what the bottom is doing and where on it to look.
- Hump: Closed rings that shallow toward the center. This is a rise surrounded by deeper water. Fish the edges and the top break.
- Ledge: Stacked or merged lines along a contour. This is an abrupt step. Check the base and the lip.
- Point: A V pointing deeper. This is a ridge of bottom running out into deep water. Look at the tip, where lines pinch.
- Channel or cut: A V pointing shallower. This is a trough running into shallower bottom.
- Saddle: A low between two sets of rings. This is a pass connecting two humps. Fish moving between the humps may use it, so check it, though that is a reason to look and not a rule.
- Secondary break: A second tightening below or above the main break. It is easy to miss at a coarse interval.
| Pattern on the map | What the bottom is doing | Why to look there |
|---|---|---|
| Tight lines | Steep slope or drop-off | The breakline is the first edge to mark |
| Wide lines | Flat or gentle slope | Low relief, so look elsewhere first |
| Stacked or merged lines | Abrupt ledge or wall | Check the lip and the base |
| Closed rings shallowing to the center | Hump rising from deeper water | Fish the edges and the top break |
| V pointing deeper | Ridge or point running into deep water | The pinch at the tip is the spot |
| Low between two rings | Saddle connecting two humps | A pass between structure |
| V pointing shallower | Channel or trough into shallow bottom | A funnel worth checking |
A named ledge with an official depth shows what this looks like in practice. Thieves Ledge lies 2.3 miles east-northeast of Point Allerton in Massachusetts Bay, with a least depth of 27 feet. The Coast Pilot notes that "the sea sometimes breaks on it." Finns Ledge, covered 27 feet, lies on the western side of the Boston North Channel entrance. Both are charted as shoal ground rising out of deeper water, which is the shape a ledge hunter looks for.
Chart Contours is a good place to practice. Find a set of closed rings and trace where the spacing tightens on each side.
Not for navigation. Contour layers are a planning aid only. Always use official NOAA charts and proper navigation equipment on the water.
Why structure fish hold on the break
Contours show where to look, and the bottom itself explains why fish are there. Three things happen on a break:
- Ambush edge. Predators sit in deeper water beside the break and hit bait that moves across the shallower shelf.
- Current seam. Moving water speeds up and folds over structure, which sets up a seam where bait gets held.
- Bait stacking. Current pushes bait against the slope.
Agency habitat descriptions match the contour patterns above. NOAA describes the NOAA Fisheries blueline tilefish profile habitat as irregular bottoms with ledges or crevices, and around boulders or rubble piles, from 98 to 774 feet on the outer continental shelf, shelf break and upper slope. On a contour map, that reads as ledge and break country.
NOAA places vermilion snapper over rock, ledges and live bottom near the edge of continental and island shelves, from 60 to 400 feet, most abundant in water shallower than 180 feet. A shelf-edge ledge inside that depth band fits the pattern.
Current makes structure visible and active. U.S. Coast Pilot 2 describes the bottom around Montauk Point for about 4 miles as very broken, with the shoals shown by rips over them at the strength of the current. Where the contours show broken ground, the water often shows it too. The Coast Pilot also describes the bottom around Point Judith as rocky and irregular with boulders, another example of broken ground worth checking.
Fish often hold on the down-current or ambush side of a break. Check both sides as the tide turns instead of committing to one.
| Structure | Depth band (NOAA) | Bottom type |
|---|---|---|
| Blueline tilefish | 98 to 774 feet | Ledges, crevices, boulders and rubble |
| Vermilion snapper | 60 to 400 feet | Rock, ledges and live bottom near the shelf edge |
Contours show where to look, and they can’t tell you whether fish are there.
MLLW: what the depth number means
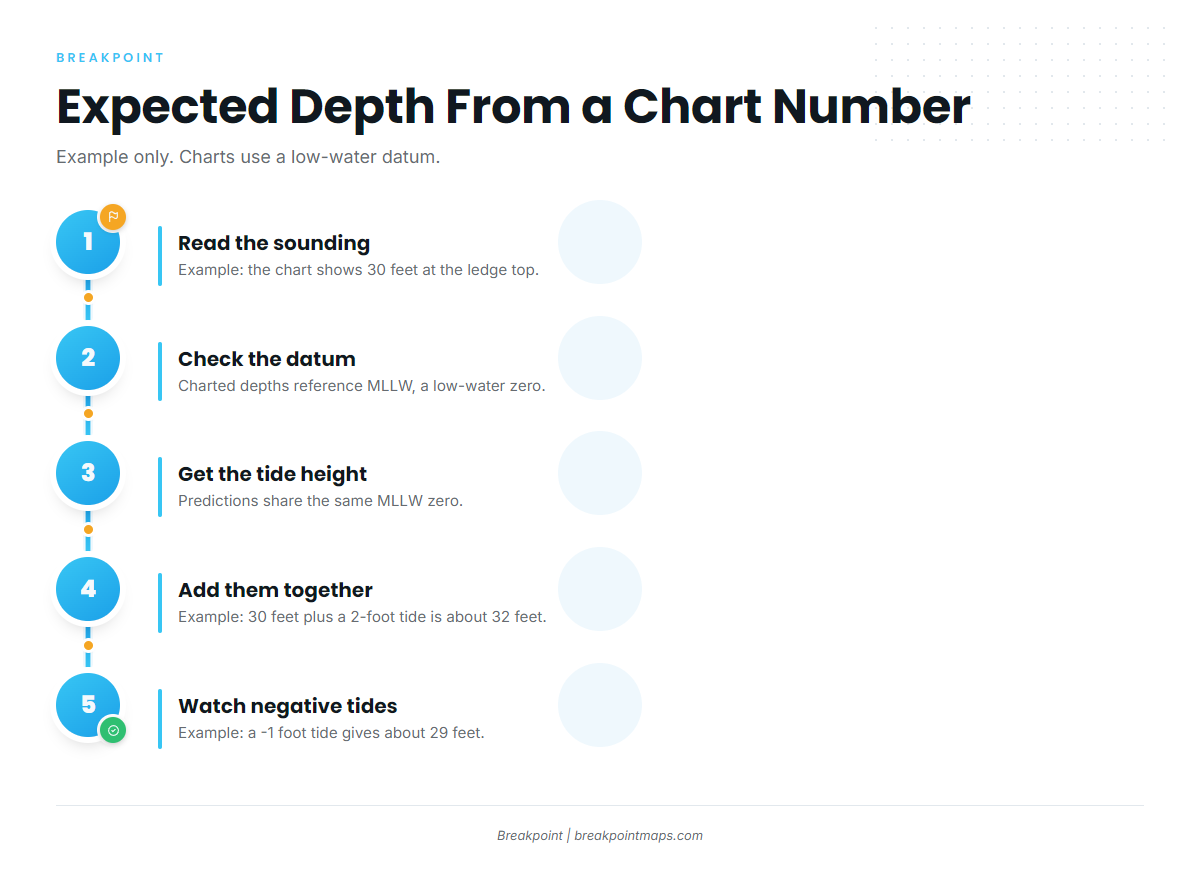
NOAA Tides & Currents defines MLLW as the average of the lower low water height of each tidal day. U.S. charts reference depths to MLLW, so the charted figure is close to the least water you will normally see, and the water is usually deeper than the charted number. Tide predictions use the same MLLW zero, so you can add them directly. Charted depth plus predicted tide height gives the expected depth.
Example only: A 30-foot sounding with a 2-foot predicted tide reads as about 32 feet. With a negative tide of -1 foot over the same sounding, expect about 29 feet.
A negative tide means less water than charted. Wind also pushes water levels away from the prediction, and the Coast Pilot notes that local wind can make the tide turn earlier or later than the tables.
The datum tells you which contour you are actually fishing at a given tide, and how much water sits over a ledge top.
What contours cannot see
Contours are a drawn estimate, and they get thin in a few predictable places.
- Interpolation. Lines are drawn between soundings, so between the measured points the line is an estimate.
- Survey age. Some areas were last surveyed long ago, and the bottom can change. Multibeam coverage is denser than older single-beam lines.
- The interval gap. A ledge smaller than the interval can fall between two lines and vanish.
- Bottom type. Contours show shape and not hardness. A tight slope can be mud or rock.
Confirm on the sounder before you commit to a spot.
Planning aid, not a navigation instrument. Contour layers help you decide where to look. They do not tell you where it is safe to run.
Not for navigation. Contour layers are a planning aid only. Always use official NOAA charts and proper navigation equipment on the water.
Pairing Chart Contours with the NOAA ENC layer
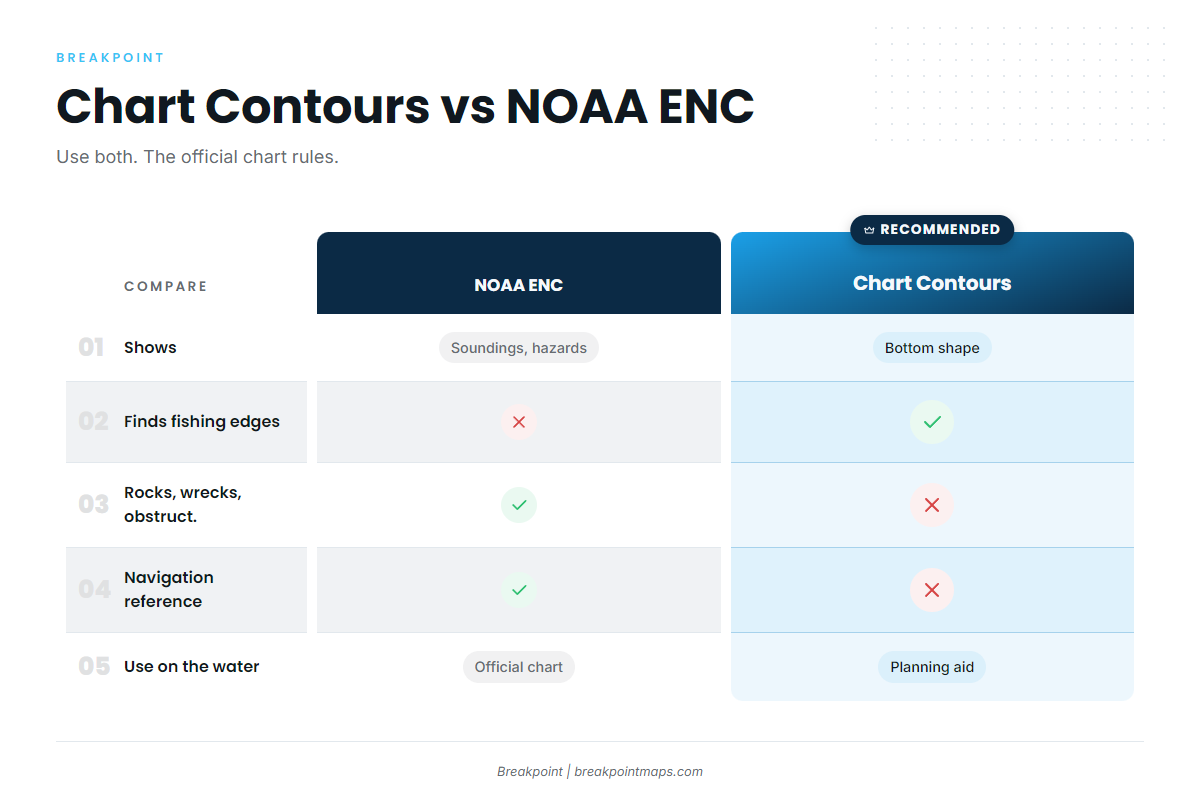
The NOAA ENC chart layer shows soundings, rocks, wrecks and obstructions that a contour line never will. Chart Contours shows the shape of the bottom and helps you find edges. The NOAA ENC is the official chart product for hazards, soundings and navigation reference. Where they disagree, the official chart and your instruments rule.
| Chart Contours | NOAA ENC | |
|---|---|---|
| What it shows | Continuous lines of equal depth | Soundings, depth areas and charted features |
| Strength for fishing | Finds breaks, humps and ledges | Confirms depths and flags what is on the bottom |
| Hazards (rocks, wrecks, obstructions) | Not shown | Shown |
| Depth reference | Read against the stated interval | Referenced to MLLW |
| Use on the water | Planning aid | Official chart reference |
Read a contour map before a trip
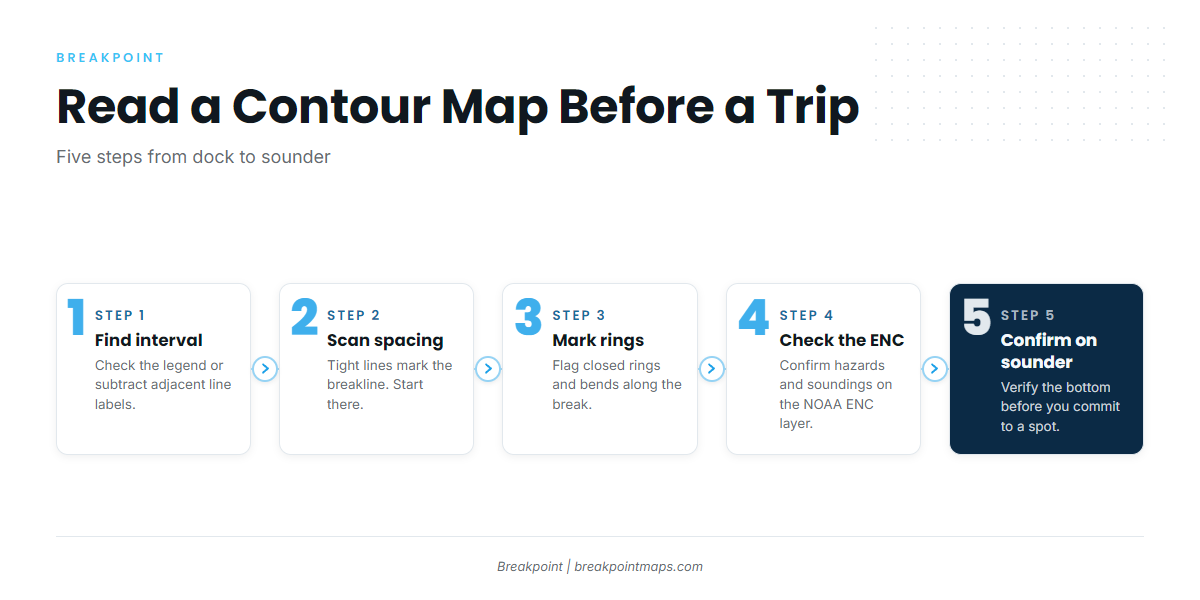
- Find the interval. Check the legend and the units.
- Scan for tight spacing. Mark where lines pull together.
- Mark closed rings and bends. Note humps, points and saddles.
- Check the ENC. Look for hazards and soundings near each spot.
- Confirm on the sounder. Trust what the water under your hull shows.
Find the break on Chart Contours, check it against the NOAA ENC layer for hazards and soundings, then confirm it on your sounder. If you want both layers on one map, you can download Breakpoint from the App Store or Google Play.
Not for navigation. Contour layers are a planning aid only. Always use official NOAA charts and proper navigation equipment on the water.
FAQ
What is a contour interval?
The contour interval is the depth difference between two neighboring contour lines. A 10-unit interval puts a line at every 10 units of depth. Find it in the legend or chart margin. If there is none, subtract the labels on two adjacent lines and confirm the units.
What do tight contour lines mean?
Tight contour lines mean the depth changes quickly over a short distance, which marks a steep slope, drop-off or breakline. "Tight" is relative to the interval. Five lines close together on a 10-foot interval show more relief than five on a 2-foot interval.
What is MLLW on a chart?
MLLW is the average of the lower low water height of each tidal day, per NOAA. Charts use it so the water is usually deeper than charted. Add the predicted tide to the charted depth. A negative tide means less water than charted.
Can a contour map miss a ledge?
Yes. A ledge with less relief than the interval can sit between two lines and never appear. Lines are also drawn between soundings, so the spots between measured points are estimates. Confirm on the sounder before you commit to a spot.
Why doesn’t my sounder match the chart depth?
Several things cause it. Tide height above MLLW changes the real depth. Wind moves water levels away from predictions. Survey age and interpolation affect the charted number. Your sounder reads from the transducer unless an offset is set. Official NOAA charts rule for navigation.