




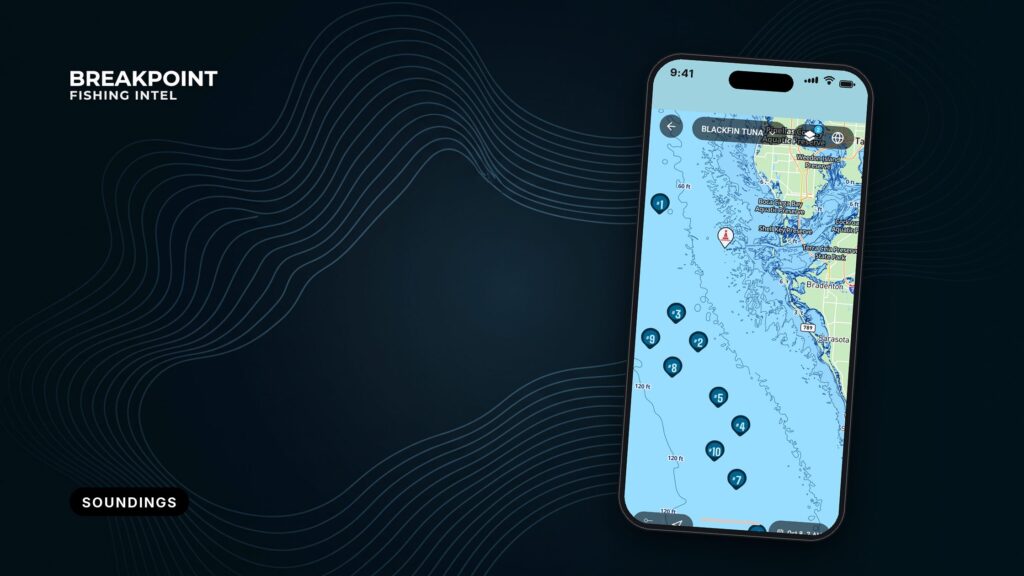
Not for navigation. Breakpoint charts are for trip planning. Navigate with official charts and your vessel’s instruments.
A sounding is the depth at one spot, measured during a survey and referenced to chart datum. Each number on the chart tells you the depth, the units, the datum it is measured below, and, through the density of its neighbors, how much weight it can bear.
This article covers how to read soundings and depth areas on NOAA ENC charts when you have to trust them underway. For fishing, soundings and depth areas show where the structure is, and survey density shows how much to believe it.
You already read charts, so this piece covers what the ENC data layer adds and where it can mislead. By the end you should be able to do the tide math, catch a unit error, decode the small digits, read depth shading as a display setting, and tell when a blank patch is unsurveyed rather than deep.
What a Sounding Is on an ENC
A sounding is a measured depth at a single point, referenced to chart datum (MLLW on U.S. charts) and recorded during a hydrographic survey. On an ENC, each sounding is a data point that the display draws as a number. It is a snapshot from the survey date.
Three points hold everywhere:
- A sounding describes one spot, not an area.
- Spot depths come from the survey, not from today’s water.
- On compatible displays, tapping a sounding returns its stored information.
Illustrative only. Not for navigation. Use official, up-to-date NOAA charts.
Hazard depths are not ordinary soundings
Rocks, wrecks and obstructions carry their own depth value and their own symbol. Near the north side of the West Gap at Point Judith lies a rock covered 12 feet. About 475 yards west of East Entrance Light 3 lies a wreck covered 6 feet, marked by a lighted buoy.
"Covered 6 feet" is the least depth over a hazard, not a sounding on open bottom. U.S. Chart No. 1 symbols show how each one is drawn.
The hazards that demand care are often the structure anglers want. For that side of the chart, see fishing wrecks, reefs and rigs.
Underlined numbers are drying heights
An underlined value is a height above chart datum, not a depth below it. The feature uncovers at low water by that amount.
| Chart element | What it shows |
|---|---|
| Plain sounding | Depth at one spot, below chart datum |
| "Covered" depth on a hazard | Least depth over a rock, wreck or obstruction |
| Underlined number | Height above datum that uncovers at low water |
Under the hood (S-57): Soundings are SOUNDG objects. Hazards are WRECKS, OBSTRN and UWTROC, with their depth in VALSOU. QUASOU and TECSOU describe the quality of a sounding and the technique used to measure it.
Units, MLLW and the Depth You Actually Have
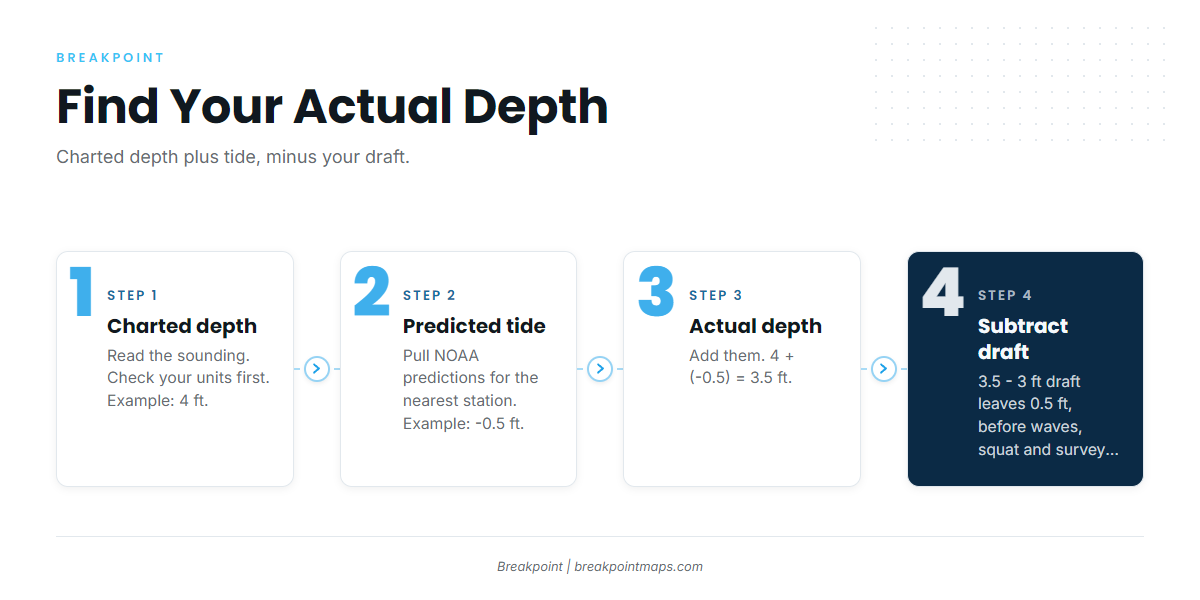
U.S. charted depths are referenced to Mean Lower Low Water (MLLW). Actual depth equals charted depth plus the predicted tide height, and tide height can be negative. ENC data is stored in meters, and your app converts it to feet, fathoms or meters.
Stored in meters, shown in your units
Check your app’s unit setting before you read any number. On NOAA charts, the unit of depth and the sounding datum are stated in the chart title. U.S. Chart No. 1 says: "In all cases the unit of depth used is shown in the chart title."
The fathom trap
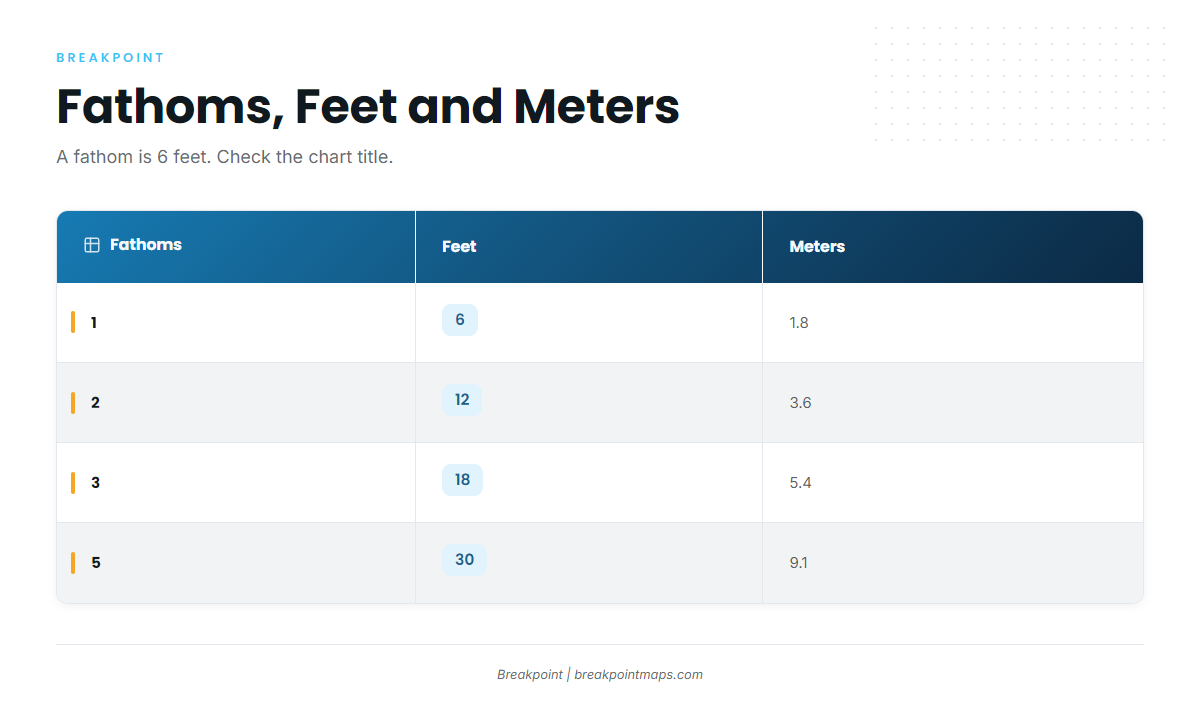
A fathom is 6 feet, so reading fathoms as feet understates the depth sixfold.
| Fathoms | Feet | Meters |
|---|---|---|
| 1 | 6 | 1.8 |
| 2 | 12 | 3.6 |
| 3 | 18 | 5.4 |
| 5 | 30 | 9.1 |
MLLW, and when the tide drops below it
MLLW is an average of the lower low tides, so some tides fall below it. That is a negative tide, and it means less water than charted.
The 4-step depth calculation
Take a 4 ft sounding on a day with a negative tide:
- Charted depth: 4 ft.
- Predicted tide: -0.5 ft.
- Actual depth: 4 + (-0.5) = 3.5 ft.
- Subtract a 3 ft draft: that leaves 0.5 ft, before waves, squat or error in the survey itself.
That is arithmetic, not a verdict. Pull NOAA real-time water level data and official tide predictions for the nearest station before you commit to shallow water. The sounding is from the survey date, and shoals move.
Under the hood (S-57): Depth units are fixed as meters in the DSPM field (DUNI subfield). IHO S-57 encoding guidance sets this. The sounding datum is the dataset default, and M_SDAT appears where an area’s datum differs.
Small Subscript Digits Next to Soundings
Under 30 meters, NOAA ENC soundings are shown in meters with a small subscript digit for tenths, so 3₄ means 3.4 meters, or about 11 feet. Older charts used other styles, including fathoms with feet, so check the units before you read the digit.
NOAA’s ENC rescheming guidance states: "Soundings less than 30 meters deep are stored and displayed as meters with subscripts in tenths of meters (decimeters) – a granularity smaller than 4 inches."
Two examples:
- 3₄ is 3.4 m, or about 11 ft.
- 1₈ is 1.8 m, or about 6 ft.
U.S. Chart No. 1 lists several older styles: fathoms, feet, fathoms and feet, fathoms and fractions, or meters and decimeters. On a fathoms-and-feet chart, the small digit is feet, not tenths, so the same-looking digit means different things depending on the units in the title.
Under the hood (S-57): The subscript is a display rendering of a decimal depth value. That value is the third coordinate of the sounding point.
Depth Areas and Depth Contours
Depth areas are shaded zones that each cover a range of depths. Depth contours are the lines of equal depth that bound them. On ENCs, the shading follows your display’s safety contour and shallow settings, so the same chart can look different in different apps.
Shading is a setting, not a depth
Each depth area carries a minimum and maximum depth. The colors come from your display settings, which is why two apps showing the same NOAA cell look different.
Why contour values look odd
Early ENCs were digitized from paper charts. Their depths were converted from fathoms and feet to meters, which left what NOAA calls "a rather unwieldy set of depth contour values to decipher." The conversion table above shows where the odd values come from. Gridded ENCs move to standard whole-meter contours.
Missing and mismatched contours
Contour intervals depend on relief:
- On larger-scale ENCs, the 3, 4, 6, 7 and 8 m contours are compiled only in gently sloping areas.
- In very steep areas, the 2 and 5 m contours may also be left out.
- Same-value contours compiled at different scales sometimes do not match where cells meet.
Safety contour fallback
Under IHO S-52 display behavior, if the safety contour you request is not coded in the cell, the display draws the next deeper contour. A 20 ft request on a U.S. chart can show a deeper line, so the shaded shallow zone grows.
Controlling depth versus project depth
In federally maintained channels, ENCs show controlling depths, while paper charts showed project depths.
Egmont Channel at Tampa Bay has a federal project depth of 45 feet in the entrance. North Channel off Pass-a-Grille was reported with a controlling depth of 3 feet, and the shading around it does not show that.
Reading the lines
ENC contours are sparse navigation lines. Finer bottom shape comes from broader bathymetry; see reading bathymetry contours.
Two signals matter for fishing. Tight contour spacing marks a steep edge, and a cluster of shallow soundings in deep water marks an isolated hump. More on both in ledges, humps and drop-offs.
Illustrative only. Not for navigation. Use official, up-to-date NOAA charts.
Under the hood (S-57): Depth areas are DEPARE, with the range in DRVAL1 (shallow) and DRVAL2 (deep). Contours are DEPCNT, with the depth in VALDCO. S-102 is a gridded bathymetric surface product, distinct from point soundings.
Dense vs. Sparse Soundings: What They Say About Survey Quality
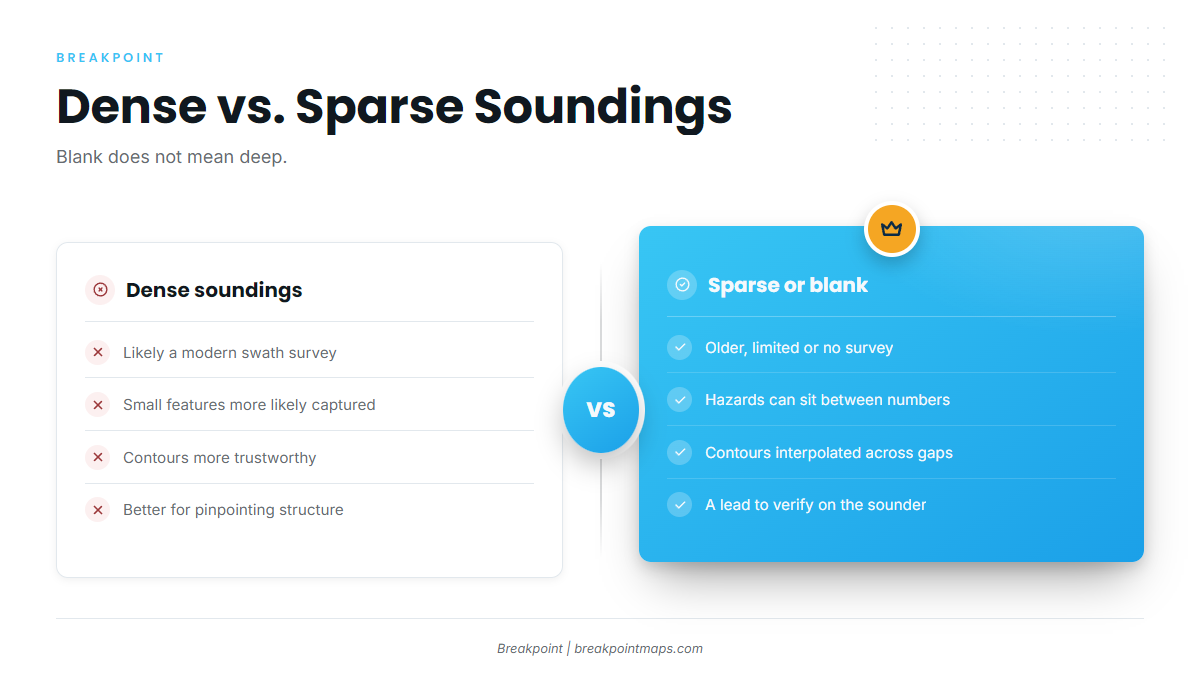
Dense soundings usually mean a modern, detailed survey. Sparse or missing soundings mean older or limited survey work, where a shoal or boulder can sit between the numbers. A blank area does not mean deep water. Check the survey quality rating in NOAA’s chart viewer.
Multibeam versus lead line
Modern multibeam sonar covers the bottom in swaths, which produces many soundings. Lead-line work sampled points, so a boulder can sit between them.
Age matters
In the Lower Keys, older survey depths for Newfound Harbor, Niles, Kemp and Bow Channels run about 3 to 5 feet. Kemp is 3 feet at the entrance and 5 feet in the channel, and local knowledge is advised. Bow Channel is not recommended for drafts over 2 feet without a pilot.
Blank does not mean deep
At Diamond Shoals, the Coast Pilot says hydrography is not charted because the area keeps changing, with depths as shallow as 3 feet. At Hatteras Inlet, the bar shifts continually, and the buoys over it are not charted because they are moved often.
A blank on the chart is a gap in the data, not a promise of water.
| Dense soundings | Sparse or blank |
|---|---|
| Likely a modern swath survey | Older or limited survey, or uncharted |
| Small features more likely captured | Hazards can sit between numbers |
| Contours more trustworthy | Contours interpolated across gaps |
| Better for pinpointing structure | Treat as a lead to verify on the sounder |
Each area also carries a quality rating for the survey behind it, viewable in NOAA’s chart viewer. Watch the depth sounder against the chart along the way.
Illustrative only. Not for navigation. Use official, up-to-date NOAA charts.
Under the hood (S-57): M_QUAL is the meta object that holds the quality assessment, with the zone of confidence in CATZOC. In GDAL, soundings come in as 3D multipoints. Set SPLIT_MULTIPOINT to get one feature per sounding. ADD_SOUNDG_DEPTH adds a DEPTH attribute and works only with SPLIT_MULTIPOINT. See the GDAL S-57 driver documentation.
Putting It Together for Fishing
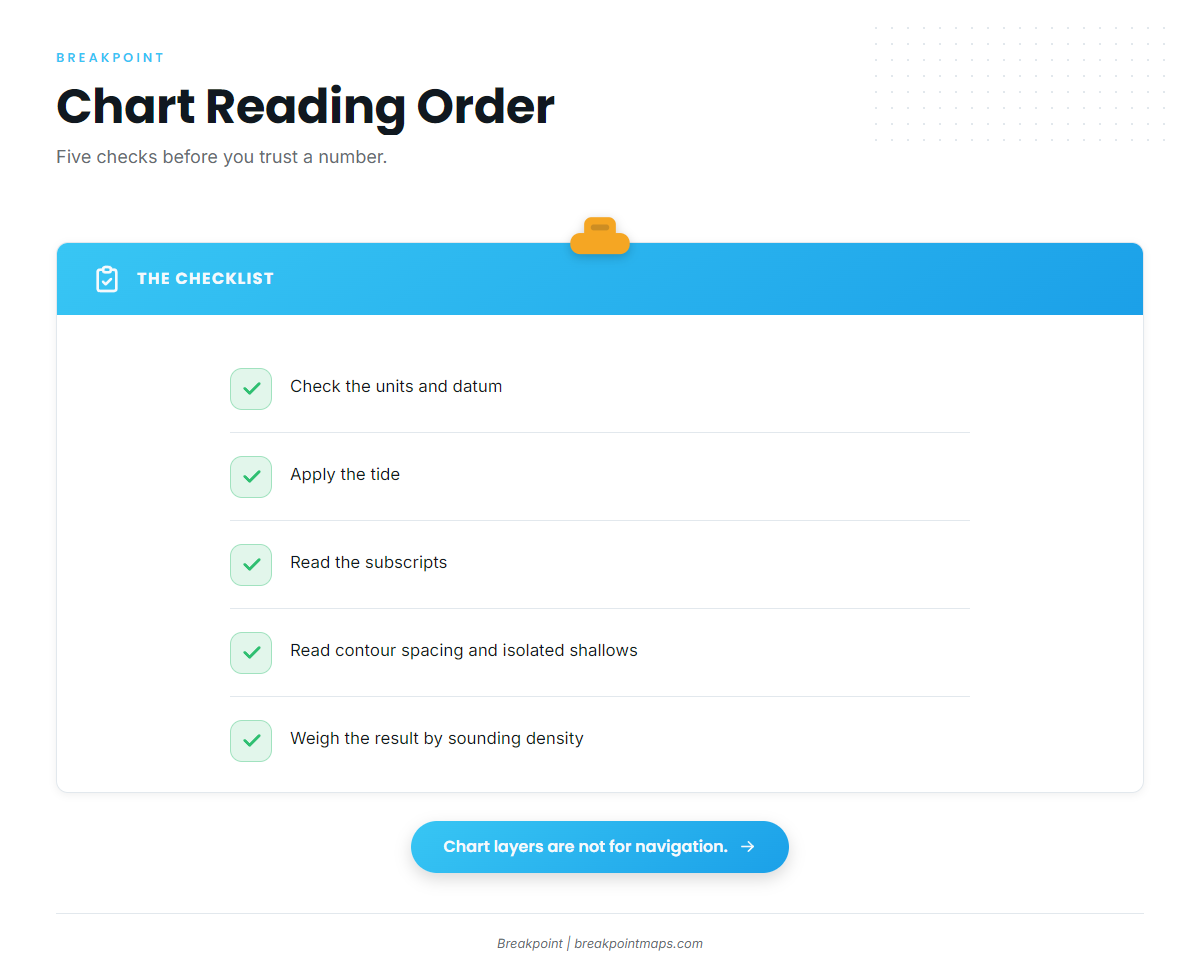
Read the chart in this order:
- Check the units and datum.
- Apply the tide.
- Read the subscripts.
- Read the contour spacing and any isolated shallow soundings.
- Weigh the result by sounding density.
Where soundings are dense, trust the edges and humps enough to plan a drift. Where they are sparse, treat the chart as a lead and let the sounder confirm it. For how survey quality ties into where to look, see reading bottom structure for fishing.
To gauge how much of the chart to believe, pull up your own grounds and count the soundings around the edges you fish. That count improves the decision about where to look, though it says nothing about whether fish are there.
Illustrative only. Not for navigation. Use official, up-to-date NOAA charts.
S-57 Depth Attribute Reference
This table maps the S-57 objects and attributes covered above to their plain meanings.
| Object / attribute | Plain meaning |
|---|---|
| SOUNDG | Spot soundings, stored as 3D multipoint |
| VALSOU | Depth value of a hazard (wreck, obstruction, rock) |
| QUASOU / TECSOU | Quality of the sounding / technique used to measure it |
| DEPARE: DRVAL1, DRVAL2 | Depth area minimum / maximum depth |
| DEPCNT: VALDCO | Depth contour value |
| M_QUAL: CATZOC | Survey quality zone of confidence |
| DSPM: DUNI | Depth units, fixed as meters |
In GDAL, use SPLIT_MULTIPOINT, plus ADD_SOUNDG_DEPTH if you need a DEPTH field.
Frequently Asked Questions
What does MLLW mean on a nautical chart?
MLLW is Mean Lower Low Water, the U.S. chart datum, an average of the lower low tides. Charted depths are measured below it. Some tides fall below it, which leaves less water than charted.
What do the small numbers next to soundings mean?
They are decimeters on soundings under 30 m. For example, 3₄ is 3.4 m. On older fathoms-and-feet charts, the small digit means feet. Check the units in the chart title.
How do I find the actual depth?
Actual depth equals charted depth plus predicted tide height. A 4 ft sounding with a -0.5 ft tide gives 3.5 ft, and a 3 ft draft leaves 0.5 ft. Pull official NOAA tide predictions for the nearest station.
Does a blank area on the chart mean deep water?
No. It can be unsurveyed or uncharted. At Diamond Shoals, depths run as shallow as 3 feet where the chart shows no hydrography. Check the survey quality rating in NOAA’s chart viewer.
Why are ENC contour values odd metric numbers?
They come from fathoms and feet converted to meters when paper charts were digitized. The conversion left values like 1.8, 3.6 and 5.4 m. Gridded ENCs move to standard whole-meter contours.
What do underlined soundings mean?
They are drying heights: heights above chart datum where the bottom uncovers at low water. They are not depths. U.S. Chart No. 1 shows the symbol.