




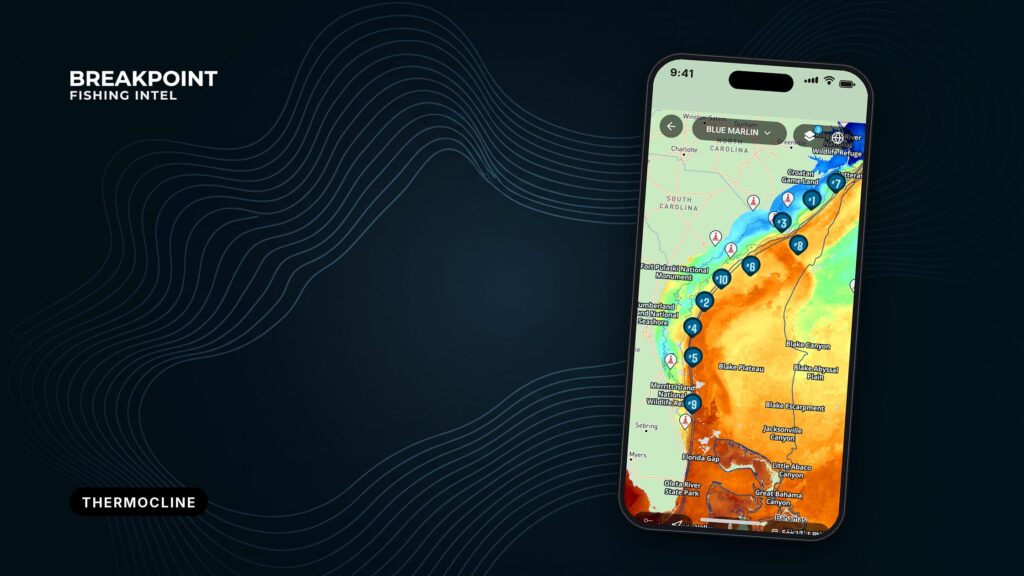
Not for navigation. Breakpoint charts are for trip planning. Navigate with official charts and your vessel’s instruments.
The thermocline is the band of water where temperature drops fast with depth. It sits below the warm, wind-mixed surface layer and above cold deep water. Offshore, it gathers bait and shapes how deep pelagic fish feed. An SST chart can’t see it. Your sounder and a probe can.
Introduction
You run 40 miles to a clean temperature break on the SST chart. The edge is sharp, the color is right, and the water looks like it should hold fish. You troll it for hours and get nothing.
The chart showed where the edge was on the surface. It didn’t show how deep the water structure under that edge sat, and that often decides where fish feed. The thermocline is the missing piece, and offshore it moves with wind, eddies and season.
This guide connects four views of the water into one decision: the surface picture (SST), the sounder, the probe and published subsurface data. It covers data and method, not catch results. If you’re newer to this, start with reading ocean water as a whole.
The aim is a better decision about where to look and how deep.
What the thermocline is
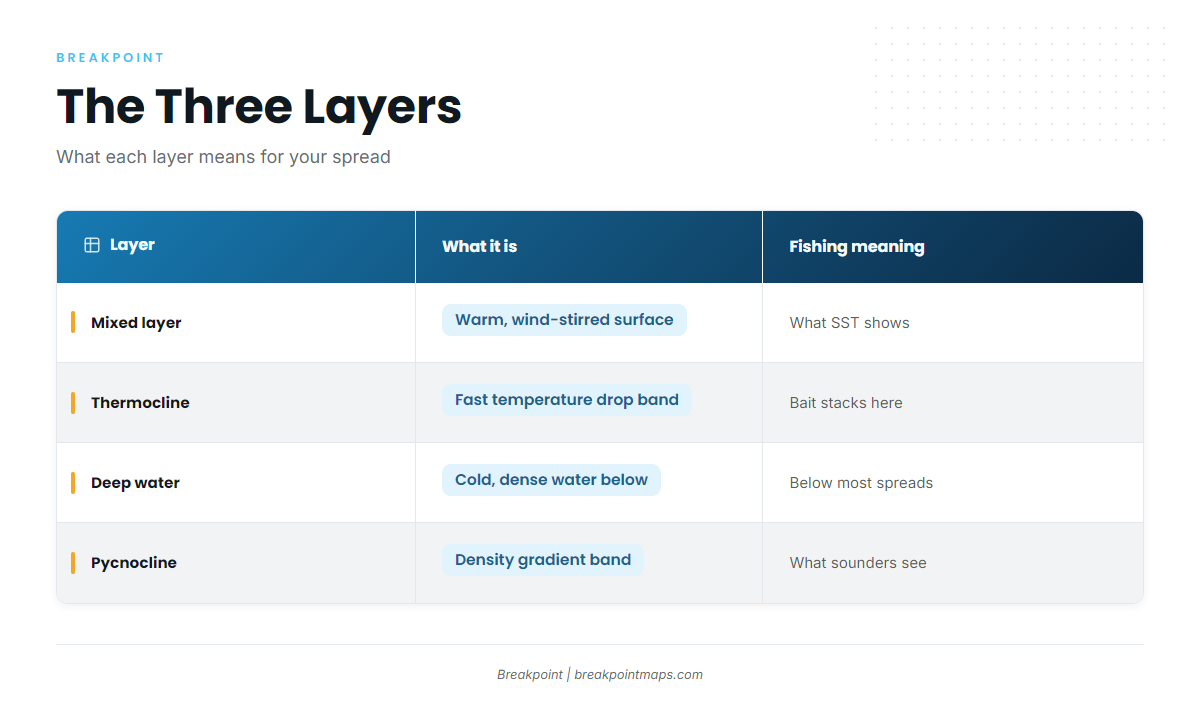
NOAA’s thermocline explainer starts at the surface. Wind and waves mix the top layer and spread the warmth through it. Below that mixed layer, temperature falls off quickly. Where that happens, and how strong it is, varies by place. The thermocline is semi-permanent in the tropics, variable in temperate regions, often deepest in summer, and shallow to nonexistent in polar regions.
It helps to picture warm, light water floating on cold, heavy water. The sun heats only the top, wind stirs only so deep, and below that the water stays cold and stays put.
Offshore anglers describe it as a band, not a hairline. It is a zone you fish, not a single depth you have to hit exactly. The depth where the mixed layer ends and the band begins is the mixed layer depth.
| Layer | What it is | What it means for fishing |
|---|---|---|
| Mixed layer | Warm surface water stirred by wind and waves | What SST shows; surface baits work here |
| Thermocline | The band where temperature drops fast with depth | Bait often stacks against it; fish relate to it |
| Deep water | Cold, dense water below the band | Below the working zone for most trolled spreads |
Seasonal vs. permanent
A seasonal thermocline forms under summer heating in latitudes with distinct seasons. Winter cooling and rough surface conditions break it down.
A permanent one sits far deeper. The permanent thermocline depth range runs from about 660 feet (200 m) to about 3,000 feet (1,000 m). The seasonal layer is much shallower, and it is the one most trolled spreads interact with.
Thermocline, halocline and pycnocline
Temperature is only one reason water separates into layers. The density gradient behind the layer is called a pycnocline. It is often driven by changes in temperature (the thermocline) and salinity (the halocline). On the boat, this means your sounder sees the density change, not the temperature.
Not a lake thermocline. Freshwater lake guidance often treats the layer as an oxygen boundary. Offshore, the angler view is that the break matters more for temperature and bait than for oxygen. The layer that holds a low-oxygen zone in a lake can sit far deeper offshore, or not be there at all. Lake rules of thumb do not transfer.
Why it holds bait and pelagics
Anglers who fish the break report the same pattern: plankton and baitfish concentrate along it, and predators line up to feed on them. That is why a thermocline with bait on it is worth more than an empty one.
Yellowfin, bigeye, mahi, wahoo and swordfish all come up in this conversation. Their depth often relates more to the band than to the bottom:
- Above the band: surface-oriented fish working the mixed layer.
- In the band: fish feeding where bait stacks.
- Under the band: fish holding deep, often harder to tempt up.
A bait layer and the density band can overlap on the screen, so read the marks, not just the haze. The surface chart shows none of this.
The surface picture vs. the water below
SST shows the skin of the water. It doesn’t show the mixed layer depth or where the band sits, which is why a perfect-looking edge can hold nothing.
SST has real limits:
- It shows only the surface skin.
- A satellite pass blocked by cloud returns no SST for that area.
- Two sides of a break can look alike on top and differ underneath.
For the full method, see how to read a temperature break on an SST map. In Breakpoint, the OBS SST layer is your surface view. Chart and map layers are for fishing decisions, not for navigation.
Wind mixing and storms
Strong wind and storms stir the surface layer deeper and can break up a seasonal band. After a blow, the surface may look fine while the structure below has changed. Check recent wind before you trust an old chart.
Upwelling
Upwelling lifts cold, deep water and the band toward the surface, bringing nutrients and bait with it.
Warm-core and cold-core eddies
A warm-core eddy pushes the layer deeper. A cold-core eddy lifts it, much as upwelling does. The Gulf Stream, warm-core rings off the Northeast canyons and Loop Current eddies are the kind of features where this plays out.
The same surface edge can sit over a deep band on one side and a shallow band on the other. That is where reading temperature breaks ties surface edges to the structure below.
Reading it on a sounder
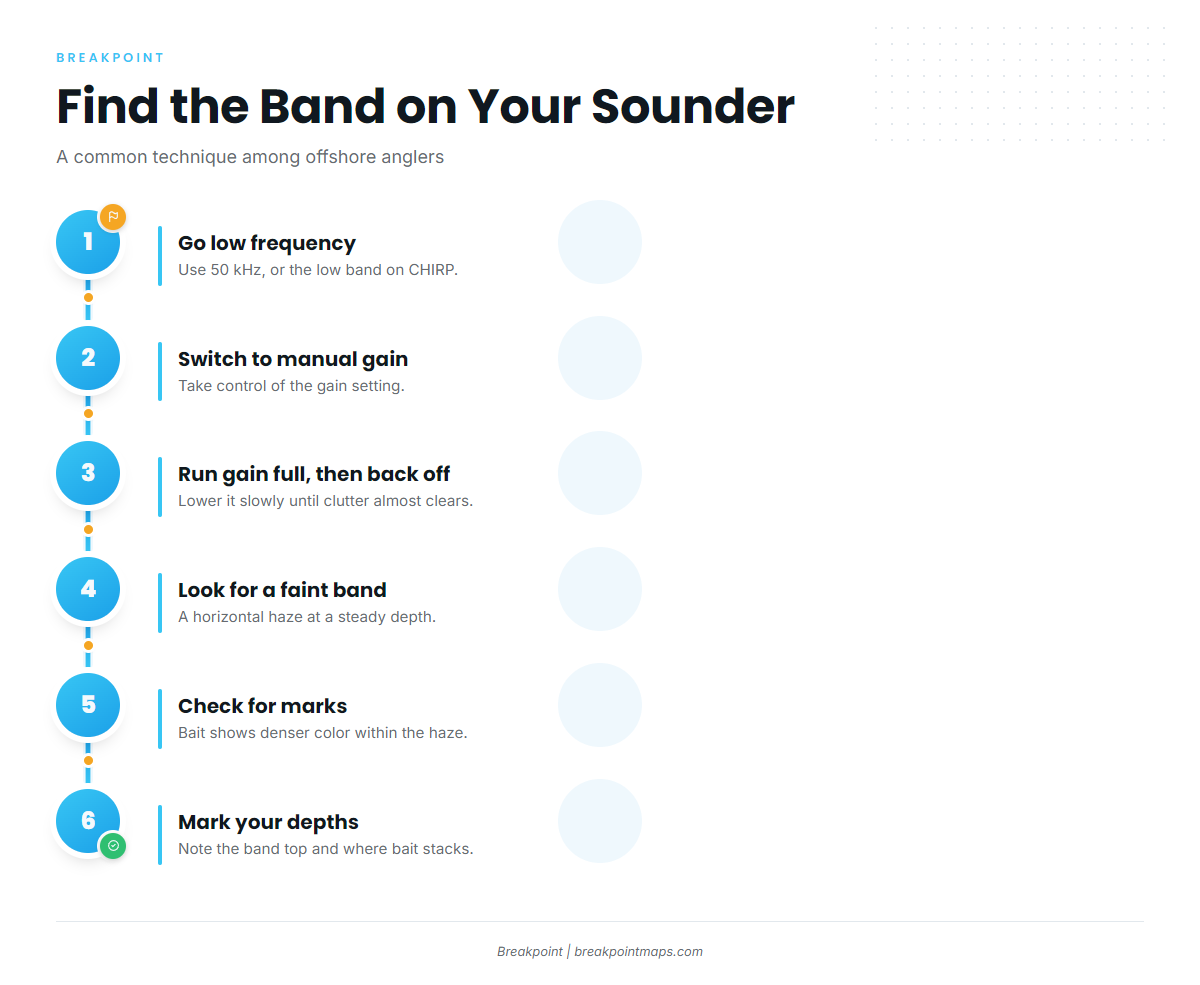
The sounder paints the density change as a faint, fuzzy band. It doesn’t read temperature.
To find the thermocline on your sounder:
- Switch to low frequency. On most units, 50 kHz is the typical channel. On CHIRP, use the low band.
- Turn on manual gain.
- Run the gain to full, then back it down slowly until the clutter almost clears.
- Look for a faint horizontal band at a steady depth across the screen.
- Note whether the band is blank or carries marks. A band with bait shows denser color within the haze.
- Mark the depth of the top of the band and the depth where bait and arches stack.
Steps 1 to 3 are a common technique among offshore anglers on The Hull Truth forum. One tip from In The Spread: if your gain is high enough to see small bait balls, it is high enough to see the band.
Because the band is a density change, it confirms structure, not temperature. A probe settles the number.
Confirming it with a probe
The probe is ground truth. Confirm the break once with a probe or downrigger sensor.
To read a probe profile:
- Drop the temperature-depth probe (or TDR, or downrigger sensor) to below the band you marked on the sounder.
- Retrieve it and read the profile of depth against temperature.
- Mark where the temperature changes fastest. Treat that as the top of the band.
- Log that depth in feet. Compare it with the sounder mark.
The bottom of the band is where the profile flattens again.
Published subsurface data
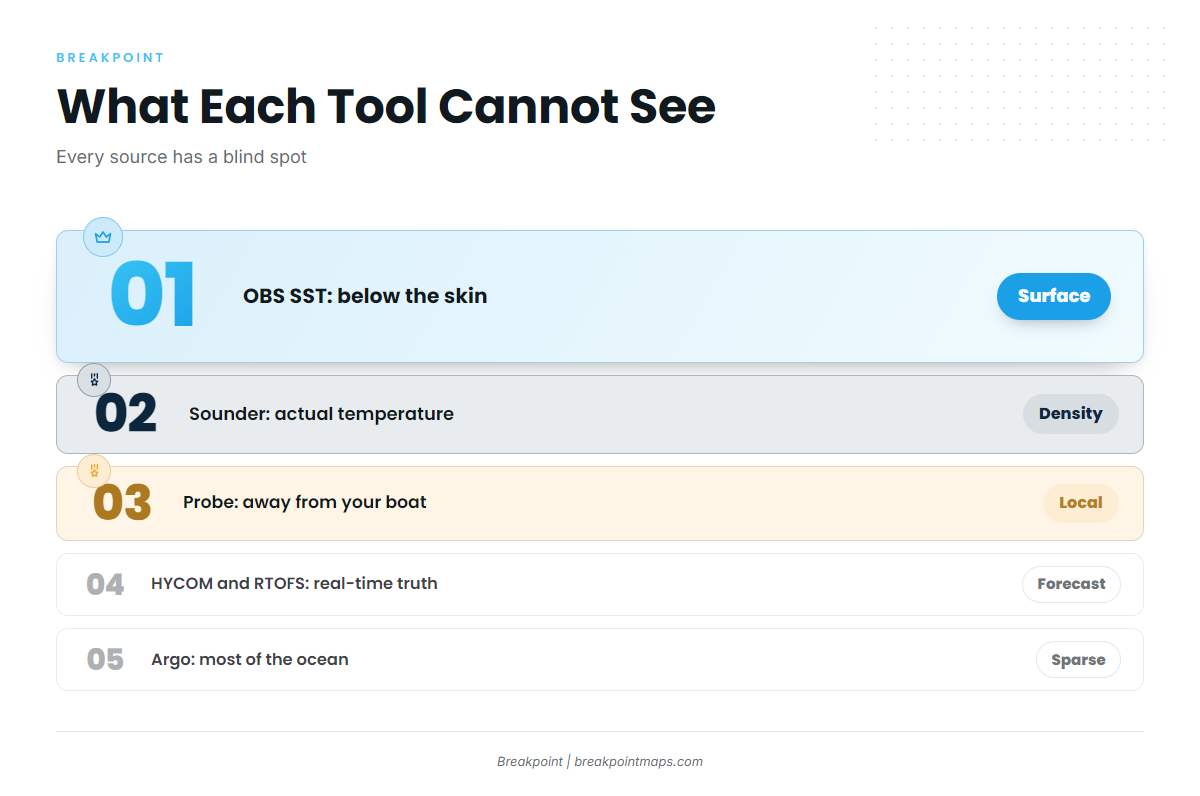
A model layer is a forecast; the probe is ground truth. Ocean circulation models track subsurface temperatures where direct measurements are thin, which makes them useful for planning and weak for final calls. Chart and map layers are for fishing decisions, not for navigation.
HYCOM
A global ocean model that estimates temperature at depth. It is a forecast and model output, not a measurement.
NOAA RTOFS
NOAA’s operational ocean forecast system. The same caveat applies: it is a model.
Copernicus Marine
The European service that publishes ocean model and observation products, including temperature at depth.
Argo
Measured profiles from drifting floats. They give real data, but they are sparse, they drift and they are rarely right where you fish. Use them to sanity-check a model, not to set a spread.
| Tool | What it measures | What it cannot see |
|---|---|---|
| OBS SST | Surface skin temperature from satellite | Anything below the skin; areas under cloud |
| Sounder | Density changes and targets | Actual temperature |
| Probe or TDR | Temperature at depth, at your boat | Anything away from your boat |
| HYCOM | Modeled temperature at depth | Real-time truth; it is a forecast |
| RTOFS | Modeled temperature at depth | Real-time truth; it is a forecast |
| Copernicus | Modeled and observed ocean products | Your exact spot at this hour |
| Argo | Measured profiles from floats | Most of the ocean at any moment; floats are sparse and drift |
Putting it together before and during the offshore trip
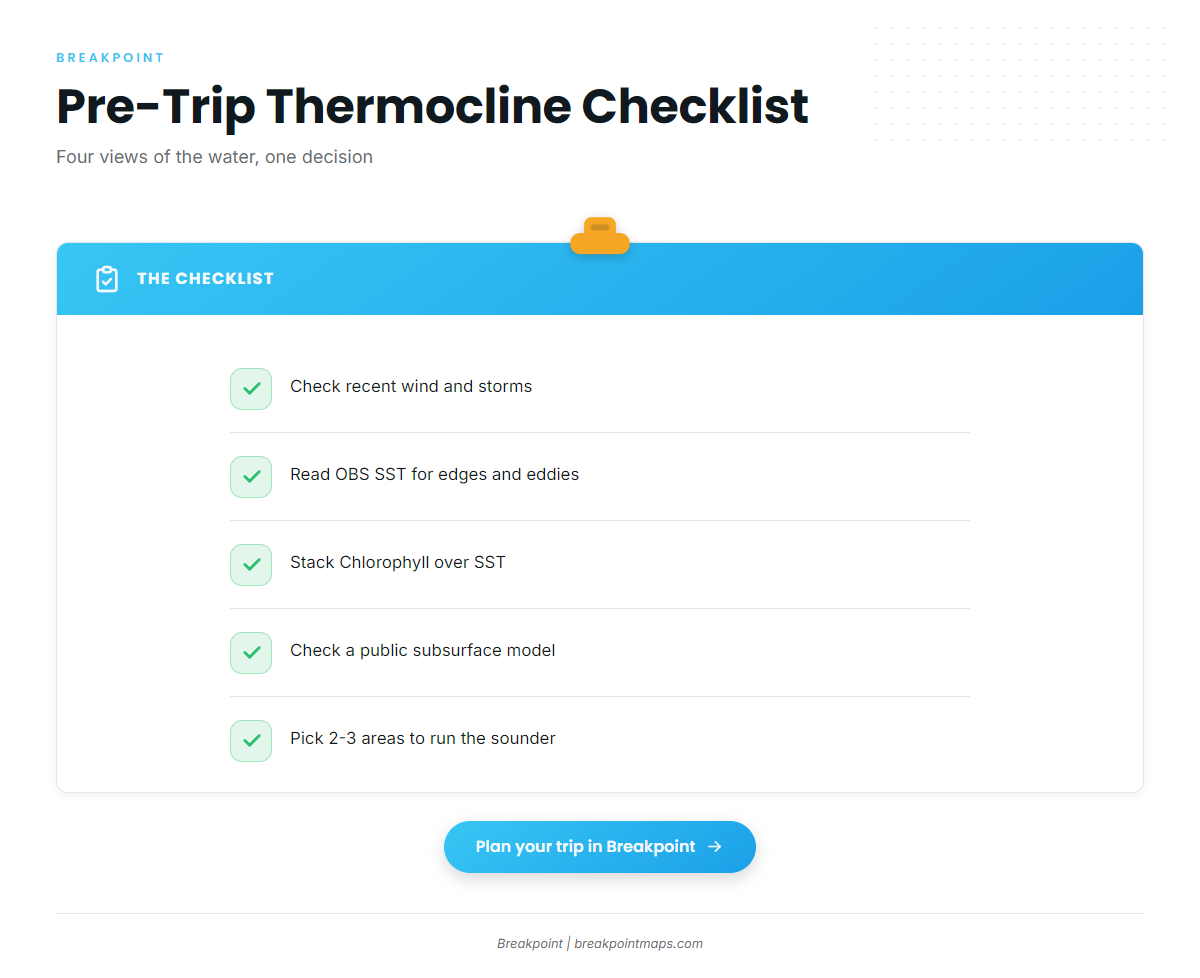
Work from the big picture down to the boat.
Before you leave the dock:
- Check recent wind and storms for anything that mixed the column.
- Read OBS SST for edges, eddies and rings.
- Stack the Chlorophyll layer over SST. For how that works, see chlorophyll and water color maps.
- Check a public subsurface model for where the band likely sits on each side of the edge.
- Pick 2 to 3 areas to run the sounder.
In Breakpoint, check the OBS SST and Chlorophyll layers together before you choose where to run the sounder. Chart Contours add the bottom reference. Chart and map layers are for fishing decisions, not for navigation.
On the water:
- Scan with the sounder at the chosen areas.
- Mark the band and the bait.
- Confirm once with the probe.
- Trust the probe over the model.
Fishing the depth
Set part of the spread to reach the logged depth using planers, downriggers or deep-diving plugs. Keep surface baits out too. Because the layer is a band, a bait set a little high or low still sits in the zone.
- Deep band: run more of your gear deep.
- Shallow band: more of the spread fishes it naturally.
FAQ
What is a thermocline in the ocean?
It is the band where water temperature drops quickly with depth. It sits between the warm, wind-mixed layer on top and cold, dense water below. Offshore, it influences where bait collects and how deep predators feed.
How is an ocean thermocline different from a lake thermocline?
Offshore, the break matters more for temperature and bait than for oxygen, which is the angler view. In lakes, the layer is often treated as an oxygen boundary. Lake rules of thumb do not transfer to saltwater.
What is the difference between a thermocline, halocline and pycnocline?
A thermocline is a temperature gradient. A halocline is a salinity gradient. A pycnocline is a density gradient, often caused by both. Your sounder sees the density change, which is why the band shows on screen.
Why does a temperature break hold no fish?
SST shows only the surface. The band below may sit too deep, or wind may have mixed it out. Check the sounder for the band and a probe for the number before you commit.
Which sounder frequency shows the thermocline?
Low frequency, with 50 kHz as the typical channel. Use manual gain, run it to full, then back it down until the clutter almost clears. This is common angler practice.
How reliable are subsurface models like HYCOM and RTOFS?
They are forecasts, useful for choosing an area. Confirm with a probe. Argo floats give real but sparse checks. Treat any model as a plan, not a measurement.
Conclusion
Each view has a job:
- The surface chart tells you where.
- The sounder shows structure.
- The probe gives you the number.
- Models help you plan.
When they disagree, go with the probe. Build your next trip plan in Breakpoint, with the aim of a better decision about where to look and how deep. You can download Breakpoint from the App Store or Google Play.