




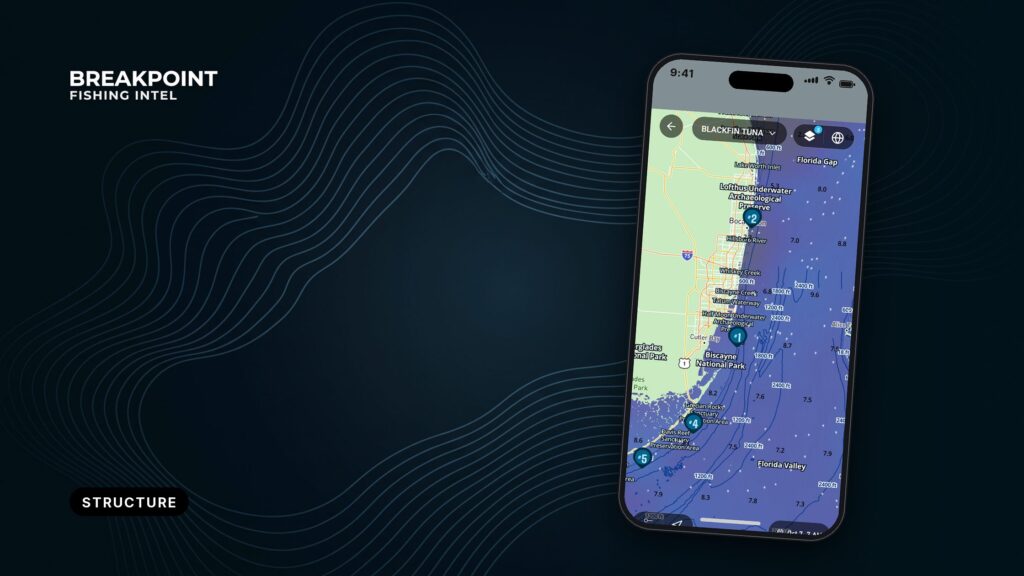
Not for navigation. Breakpoint charts are for trip planning. Navigate with official charts and your vessel’s instruments.
Contour spacing shows the shape of the bottom. Tightly packed lines mean depth changes quickly; widely spaced lines mean it barely changes. Ledges, humps and drop-offs are all bottom relief you can read from a chart before you ever wet a line.
They are 3 of the patterns covered in reading bottom structure, and each has its own contour signature. You read the chart, and you also judge the survey behind it, since a chart is only as good as its survey.
This guide covers:
- How to spot each feature on your own plotter
- Why fish use each one
- A worked reading of Stellwagen Bank and 2 Boston Harbor ledges
- How to tell when the chart cannot be trusted
It gives no numbers to copy, only a better basis for deciding where to look.
What contour spacing tells you
A contour line, also called an isobath, joins points of equal depth on a bathymetric chart. Each line is a depth, and the gap between lines shows how the bottom changes.
Start with the interval, the depth step between neighboring lines, and read the labels before you read the shape. We cover how bathymetry contours are drawn and labeled in a separate guide.
Then read the spacing as slope:
- Tight spacing means a steep slope.
- Wide spacing means a flat.
- Uneven spacing means the slope changes along the way.
Check the units before you judge any of it. Charts and chart layers can label depth in feet, fathoms or meters, and the same spacing reads very differently in each. One fathom is 6 feet, so a chart in fathoms with a 5-fathom interval steps 30 feet at a time. Look for the units note on the chart.
Common mistake: fish relate to the break between lines, where depth changes fastest. They do not relate to a single line or to the center of a hump.
| Line set | What you see | What the bottom does |
|---|---|---|
| Tight | Lines packed close | Steep slope, depth changes fast |
| Wide | Lines far apart | Flat, depth barely changes |
| Stepped | Wide band, then tight bunch | Flat shelf, then a drop |
Graphic suggestion: three line sets (tight, wide, stepped) side by side, each with a profile view underneath. Caption: Chart layers are for planning and are not for navigation. Use official NOAA charts to navigate.
You can see this spacing on your own water in the Chart Contours layer in Breakpoint Maps.
Drop-offs, ledges and humps on the chart
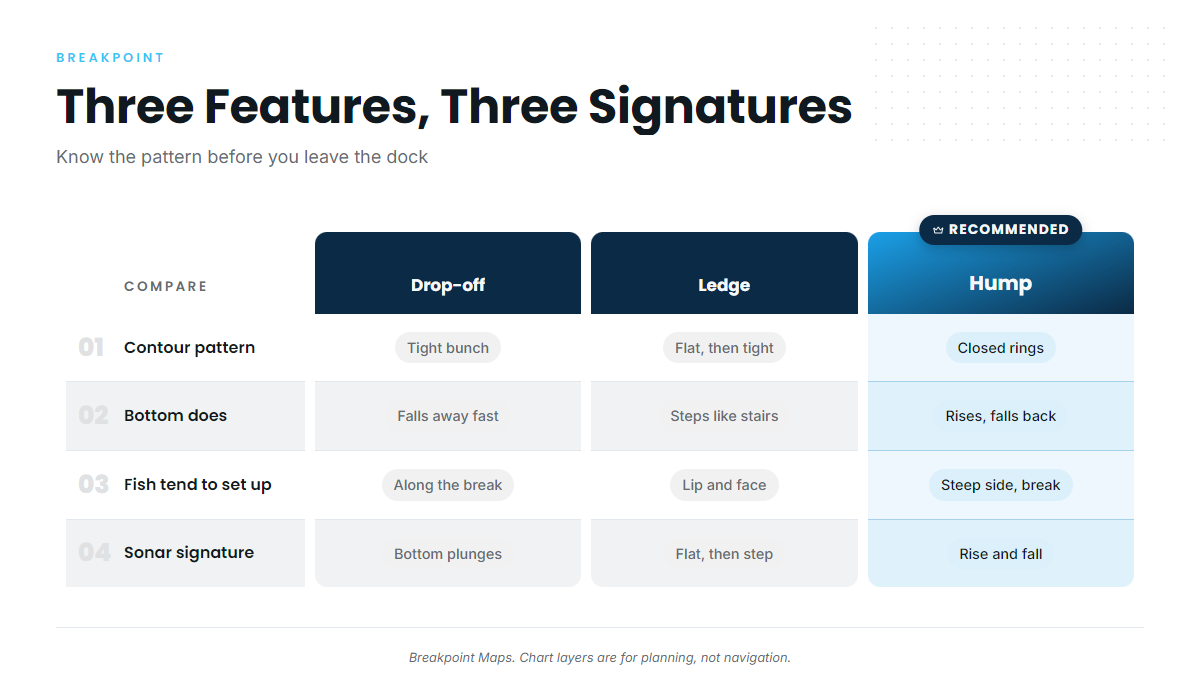
Each feature has a recognizable pattern, and once you know it you can pick it out in seconds.
Drop-offs
A drop-off is where the bottom falls away fast. On the chart it shows as a tight bunch of contour lines with wider spacing on both sides.
The shelf edge is the largest-scale drop-off. Run your eye along the tight bunch and find where it turns or bends. Bends and corners often matter more than the straight runs.
Graphic suggestion: a tight bunch of lines with a profile view of the plunge. Caption: Chart layers are for planning and are not for navigation. Use official NOAA charts to navigate.
Ledges
A ledge is a step in the bottom. It reads as a flat band of widely spaced lines followed by a sudden tight bunch, like a stair step rather than a ramp.
A charted ledge can also read as a shoal sounding surrounded by deeper contours, as the Boston ledges below show. Ledges often go with hard or live bottom, but the chart rarely shows bottom type directly. Sonar confirms it.
Humps
A hump is a rise surrounded by deeper water. On the chart it shows as closed contour rings that get shallower toward the center.
Look at the whole ring and find the side where the rings pack tightest. That is the steepest face. The top of the hump is not automatically the best spot.
How the three compare
| Feature | Contour pattern | What the bottom does | Where fish tend to set up | Sonar signature |
|---|---|---|---|---|
| Drop-off | Tight bunch of lines | Falls away fast | Along the break, top and base of the slope | Bottom line plunges |
| Ledge | Flat band, then tight bunch | Steps down like a stair | At the lip and the face of the step | Flat line, then a sudden step down |
| Hump | Closed rings shallowing inward | Rises, then falls back | On the steepest side and the break, not the center | Bottom line rises and falls back |
Swipe the table sideways to see every column.
Hard bottom shows as a thicker, bolder return on any of these features.
Why fish use bottom relief
Four things pull fish to relief, and they tend to work together:
- Current deflection. Relief pushes moving water up and around it, creating current breaks and, on larger features, upwelling.
- Bait. Bait gathers where current breaks and food collects. Predators often relate to the bait more than to the rock itself.
- Ambush. The down-current side of an edge gives predators slack water next to moving water. Bait gets swept past while the predator waits in the soft spot, which is why the down-current edge matters.
- Depth access. Steep relief puts shallow and deep water close together, so a fish can change depth without traveling far.
Here is how that reads on a real bank.
A worked reading: Stellwagen Bank and the Boston ledges
Chart layers are for planning and are not for navigation. Use official NOAA charts to navigate.
Stellwagen Bank is a fishing ground for charters out of Plymouth and Boston Harbor. U.S. Coast Pilot 1 gives a route from Peaked Hill Bar to the Boston entrance buoy that crosses the southwest end of the bank. Jeffreys Ledge is a related Gulf of Maine ledge, also fished out of Plymouth. Cod, haddock and pollock are among the groundfish listed for these ports, though seasonal species vary by port.
We do not print depths, slopes or edge positions for Stellwagen Bank, so read the numbers off your own NOAA chart or ENC. What you are looking for is the pattern: a broad shallow top where lines spread wide, edges where lines pack tight, and the steepest faces on the sides where spacing is tightest.
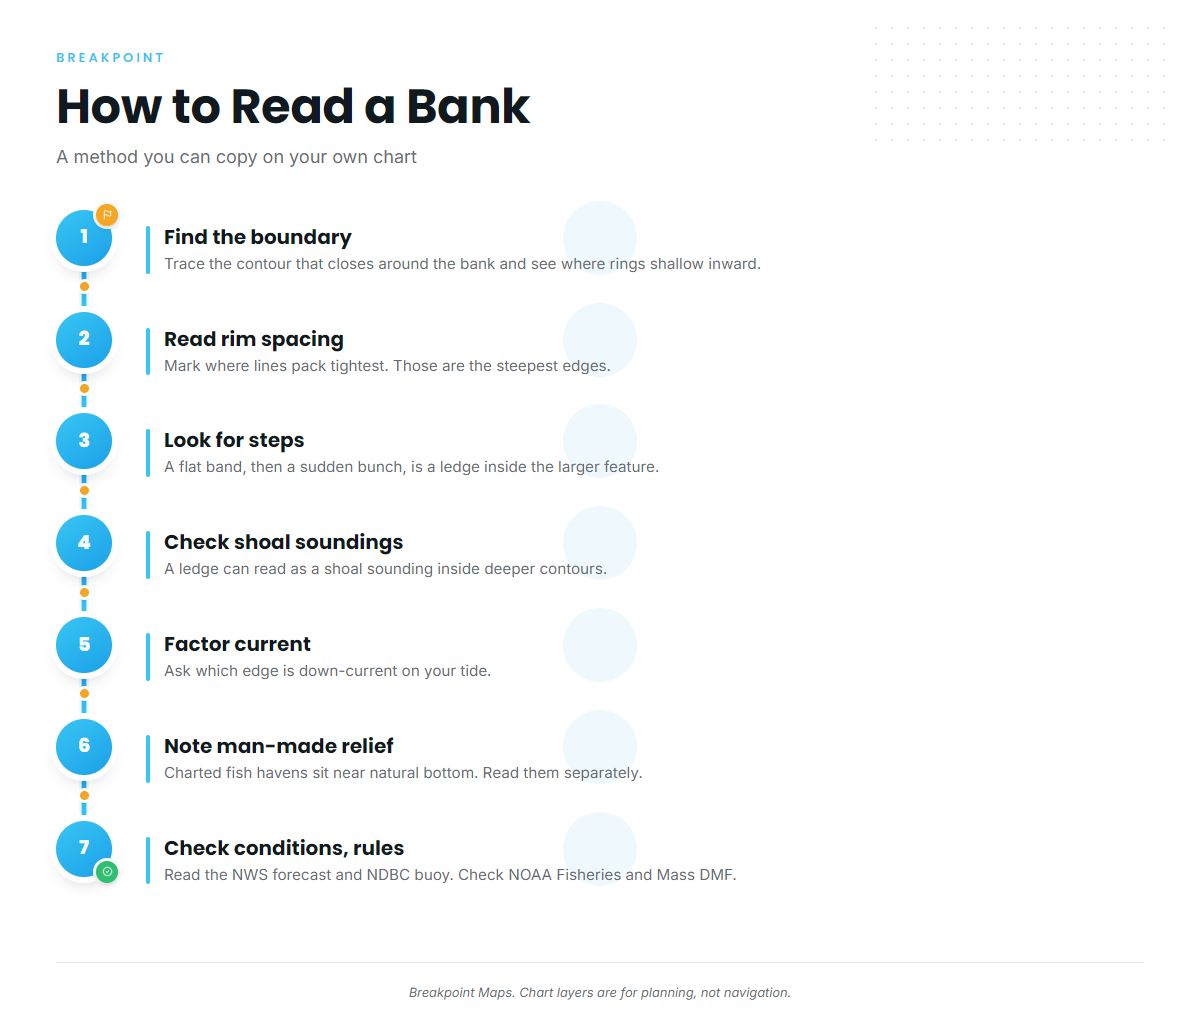
Work through it in order:
- Find the feature boundary. Trace the contour that closes around the bank and see where the rings shallow inward.
- Read the spacing around the rim. Mark where lines pack tightest. Those are the steepest edges.
- Look for steps. A flat band followed by a sudden bunch is a ledge inside the larger feature.
- Check for shoal soundings. According to U.S. Coast Pilot 1, Chapter 11 (Boston Harbor and Approaches), Thieves Ledge lies 2.3 miles east-northeast of Point Allerton, with a least depth of 27 feet, and is marked by a lighted whistle buoy. Finns Ledge, covered 27 feet, lies on the western side of the Boston North Channel entrance. Each reads as a shoal sounding inside deeper contours, which is how a charted ledge looks when the survey caught it.
- Factor current. The Coast Pilot states: "Current velocity is influenced greatly by the force and direction of the wind." It lists about 1.5 knots at strength between Boston Light and Point Allerton, and about 2 knots in Hull Gut, where the flood sets southward and the ebb northward. Then ask which edge is down-current on your tide.
- Note man-made relief nearby. The Coast Pilot lists the Sculpin Ledge Channel fish haven off Boston Harbor. Charted fish havens sit near natural bottom here, and we cover how to read wrecks, reefs and rigs separately.
- Check conditions and rules before you go. Read the NWS Cape Cod Bay forecast and the Cape Cod Bay waverider buoy for wind, wave height and period. Groundfish rules change by season and quota, so check NOAA Fisheries and Massachusetts DMF before fishing. The Outer Boston Harbor Restricted Area, a Marine Protected Area extending 5.5 miles offshore from Hull to Nantasket, is one more reason to read the rules first.
Graphic suggestion: an annotated sketch of a bank with labeled zones (wide-spaced top, tight edge, step, shoal sounding). Label it as an illustration, not a chart of Stellwagen. Caption: Chart layers are for planning and are not for navigation. Use official NOAA charts to navigate.
How survey quality changes the chart
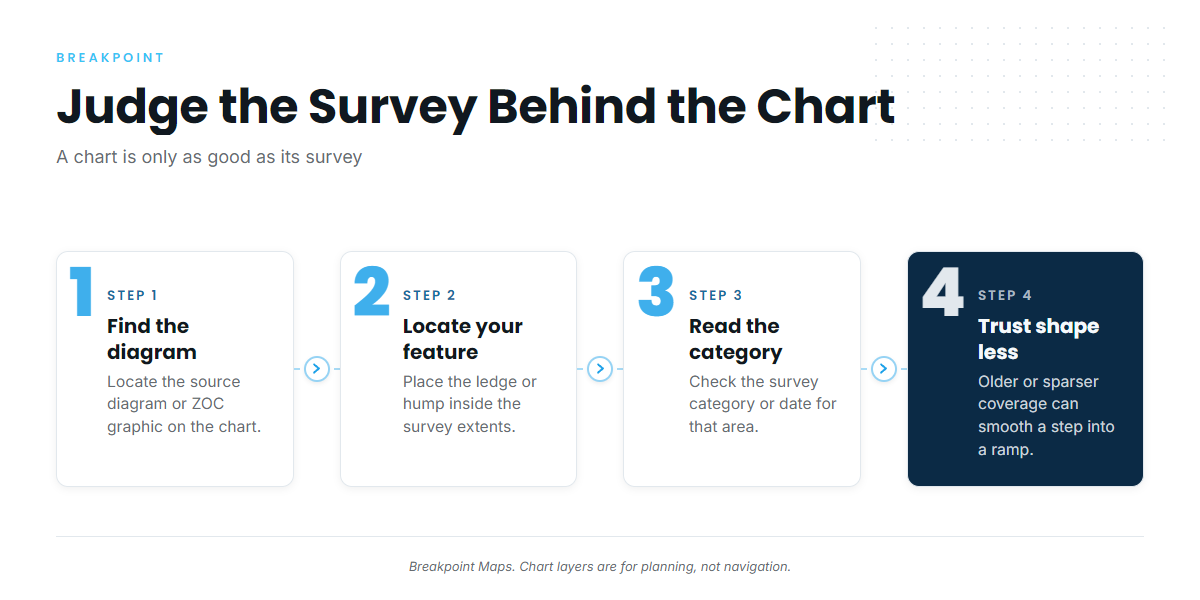
A chart is only as good as the survey behind it.
Chart layers are for planning and are not for navigation. Use official NOAA charts to navigate. That applies double when you are judging how much to trust a feature. Start with reading ENC soundings and depth areas, which shows where the underlying data comes from.
Survey method and age
Three survey methods sit behind most charts:
| Method | What it gives you | What it can miss |
|---|---|---|
| Lead-line | Individual soundings along lines | A ledge between lines can be missed entirely |
| Single-beam | A continuous profile under the track | The bottom between tracks is still unseen |
| Multibeam | A swath of bottom coverage | Resolves far more relief than the other two |
Survey age matters too. An old survey can predate shifts in sand and shoals, and a chart can carry old soundings right next to new ones.
Three public data types are worth comparing. NOAA ENC is the official electronic chart, built from charted soundings and depth areas. BlueTopo is a gridded bathymetry product built from NOAA survey data. NOAA Crowdsourced Bathymetry is depth data collected by vessels underway.
ZOC and source diagrams
Source diagrams show a graphic of hydrographic survey extents within the chart, with a table of survey quality categories. The NOAA Office of Coast Survey is replacing them on large-scale charts with a zone of confidence (ZOC) graphic and table. NOAA explains how accurate nautical charts are on its site. CATZOC is the ENC attribute that carries the zone of confidence category.
Read it this way:
- Find the diagram or ZOC graphic on the chart.
- Locate your feature inside it.
- Read the survey category or date for that area.
- Trust the shape less where coverage is older or sparser.
For the category definitions, go to NOAA’s page.
Interpolation
Sounding density sets the smallest feature a chart can show, so a small hump between soundings can drop out entirely.
Contours drawn between sparse soundings also smooth a stepped edge into a gentle slope, so a stair step on the bottom can show as a ramp on the chart.
Compare layers, and where they disagree, check with sonar.
Confirm it on sonar
Sonar is the last check. Learn the signatures:
- A hump rises and falls back in the bottom line.
- A drop-off plunges.
- A ledge shows as a flat line, then a step.
- Hard bottom shows a thicker, bolder return.
Run across the charted feature, perpendicular to the contours. Mark waypoints where the bottom line changes, then slow down over the marks.
When the chart and sonar disagree, survey method, sounding density and interpolation are the usual reasons. There is one more: your sonar reads depth below your transducer at that moment, which will not match a charted sounding exactly.
Before you leave the dock
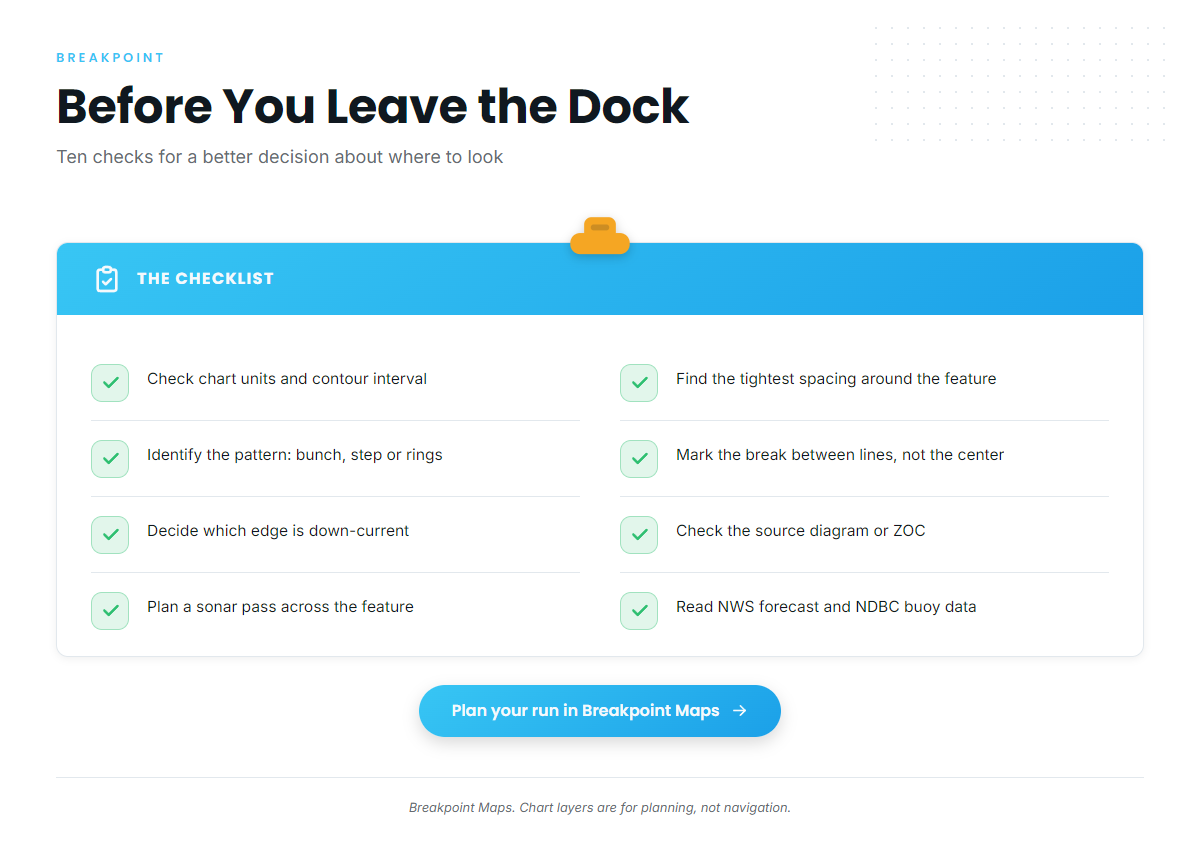
- [ ] Check the units and contour interval on the chart.
- [ ] Find the tightest spacing around the feature.
- [ ] Identify the pattern: tight bunch, flat-then-tight step, or closed rings.
- [ ] Mark the break between lines, not the line or the center.
- [ ] Decide which edge is down-current on your tide.
- [ ] Check the source diagram or ZOC for that area.
- [ ] Compare a second layer where you can.
- [ ] Plan a sonar pass across the feature.
- [ ] Read the NWS marine forecast and NDBC buoy data.
- [ ] Check NOAA Fisheries and Massachusetts DMF rules, or your own state agency’s.
Plan the next run in Breakpoint Maps before you leave the dock. We can’t promise fish, but a chart read this way gives you a better basis for deciding where to look.
Frequently Asked Questions
What is the difference between a ledge, a hump and a drop-off?
A drop-off is a tight bunch of contour lines where the bottom falls away fast. A ledge is a flat band of wide lines followed by a tight bunch, so it reads as a stair step rather than a ramp. A hump is a set of closed rings shallowing toward the center.
What does tight contour spacing mean?
Tight spacing means a steep slope: depth changes fast over a short distance. Check the chart’s units and contour interval first, because the same spacing reads differently in feet, fathoms or meters.
What is ZOC or CATZOC on a chart?
ZOC is NOAA’s zone of confidence, a graphic and table that replaces source diagrams on large-scale charts. It shows survey quality by area. CATZOC is the ENC attribute that carries the category. The NOAA Office of Coast Survey publishes the definitions.
Why doesn’t the chart match my sonar?
Survey method and age, sparse soundings and interpolation smoothing all change what the chart shows. Your sonar also reads the moment, depth below your transducer. Chart layers are for planning and are not for navigation. Use official NOAA charts to navigate.
How do I confirm a charted ledge on sonar?
Cross the ledge perpendicular to the contours. Look for a flat line, then a step down. A bolder, thicker return suggests hard bottom. Mark the change with a waypoint, then slow down and work it.