




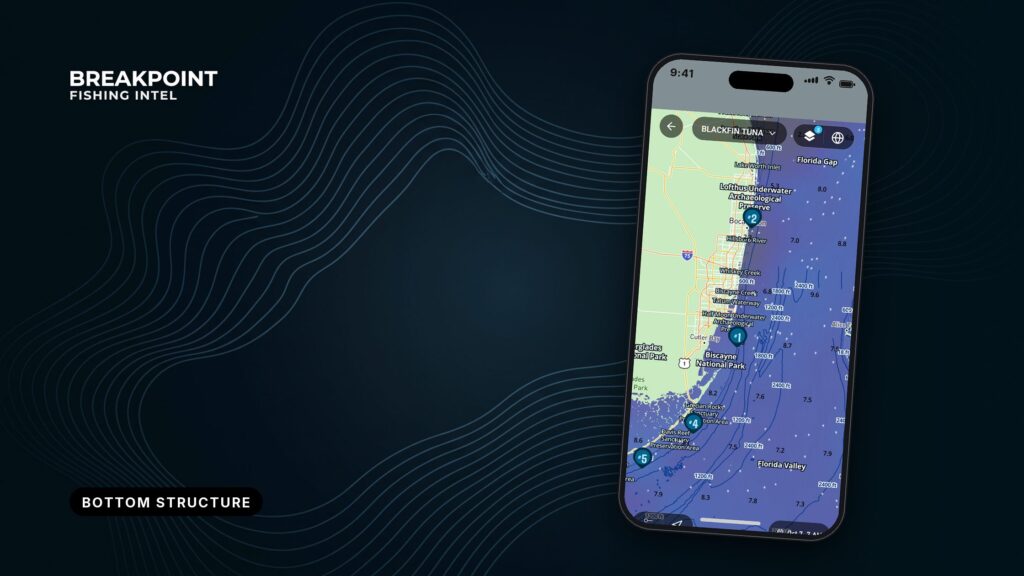
Not for navigation. Breakpoint charts are for trip planning. Navigate with official charts and your vessel’s instruments.
Every bottom map is a compilation, and knowing what went into it tells you how far to trust it. Two maps of the same water can show different depths and different structure, and your sounder can disagree with both. That comes from how the data was collected.
This page is for anglers who already read charts. Bottom data, depth contours and bathymetry each come from different surveys, built different ways. It covers what each kind of bottom data shows, how to read contour spacing on a reservoir or a shelf edge, why maps disagree, and where the official public data lives. The goal is a better decision about where to look.
Bottom Data Compared: What Each Layer Shows
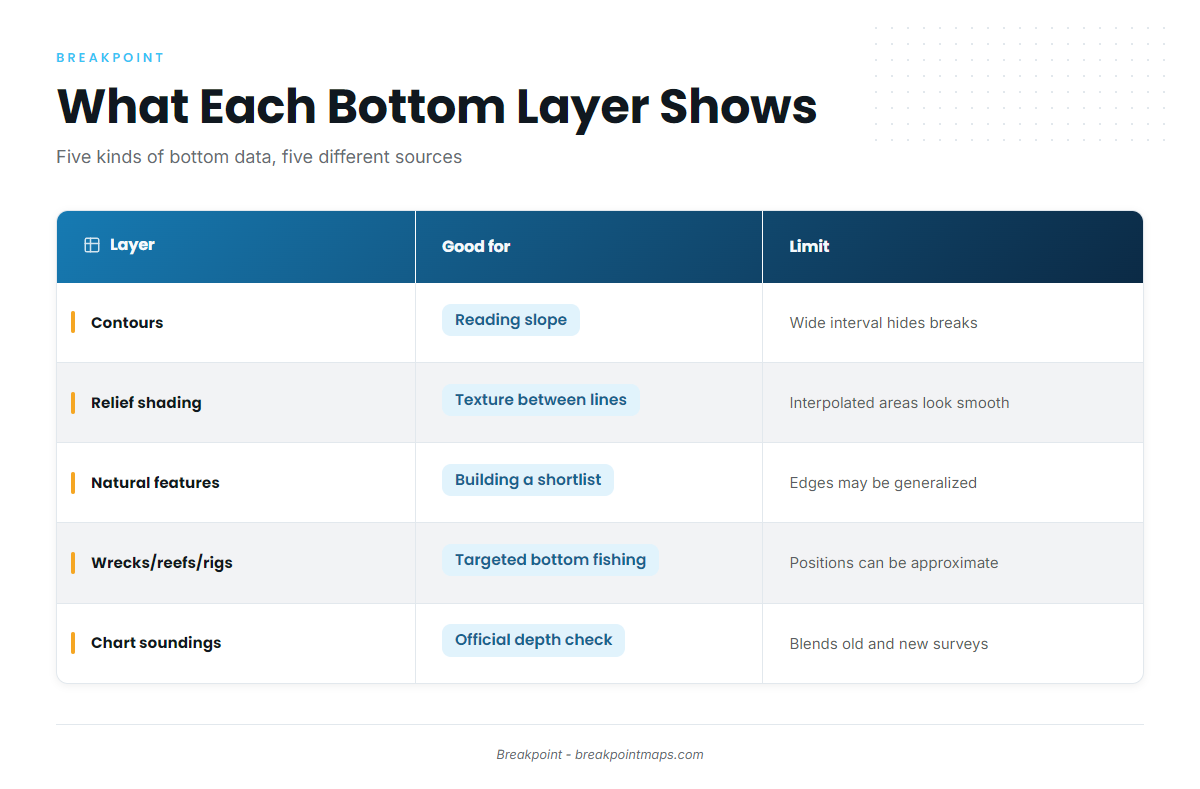
Chart layers and bottom maps are not for navigation. Use official NOAA charts and the Coast Pilot.
Five kinds of bottom data turn up on fishing maps. Each comes from a different place, and each has its own limits.
| Data type | What it shows | Where it comes from | Good for | Limits |
|---|---|---|---|---|
| Contours | Lines joining equal depth | Surveys turned into a depth surface, then lined at a set contour interval | Reading slope: drop-offs, ledges, points, humps, saddles | Only as good as the survey under it. A wide interval hides small breaks. |
| Relief shading (hillshade) | Shadowed rendering of the bottom, as if lit from one side | Gridded bathymetry | Texture between contour lines, such as ridges, troughs and edges | Shows the grid, not the survey. Interpolated areas can look smooth and convincing. Resolution limits detail. |
| Natural features | Named or mapped features such as ledges, banks, channels and holes | Charts, surveys, and features read from contours | Building a shortlist before you leave the dock | Edges are drawn from the underlying data and may be generalized |
| Wrecks, reefs and rigs | Point positions of man-made and charted structure | NOAA charts, state and county artificial reef programs, and platform records | Targeted bottom fishing | Positions can be approximate. Reported features may carry qualifiers such as "position approximate" (PA) or "position doubtful" (PD). |
| Chart soundings and depth areas | Spot depths and shaded depth bands on the official chart (ENC) | NOAA hydrographic surveys of many ages and methods, referenced to chart datum | Official depth reference, checking a fishing map | Can blend old and new surveys. Sparse in places. Depths are referenced to a low-tide datum, not today’s water. |
Swipe the table sideways to see every column.
NOAA maintains the ENC as its navigation chart product. The soundings and depth areas on it are the official depth reference, and every other bottom map gets measured against it.
For finding and fishing man-made structure, see wrecks, reefs and rigs as structure. To read the official chart itself, see reading NOAA ENC soundings and depth areas. Natural features get their own guide to ledges, humps and drop-offs.
Reading the Bottom by Contour Spacing
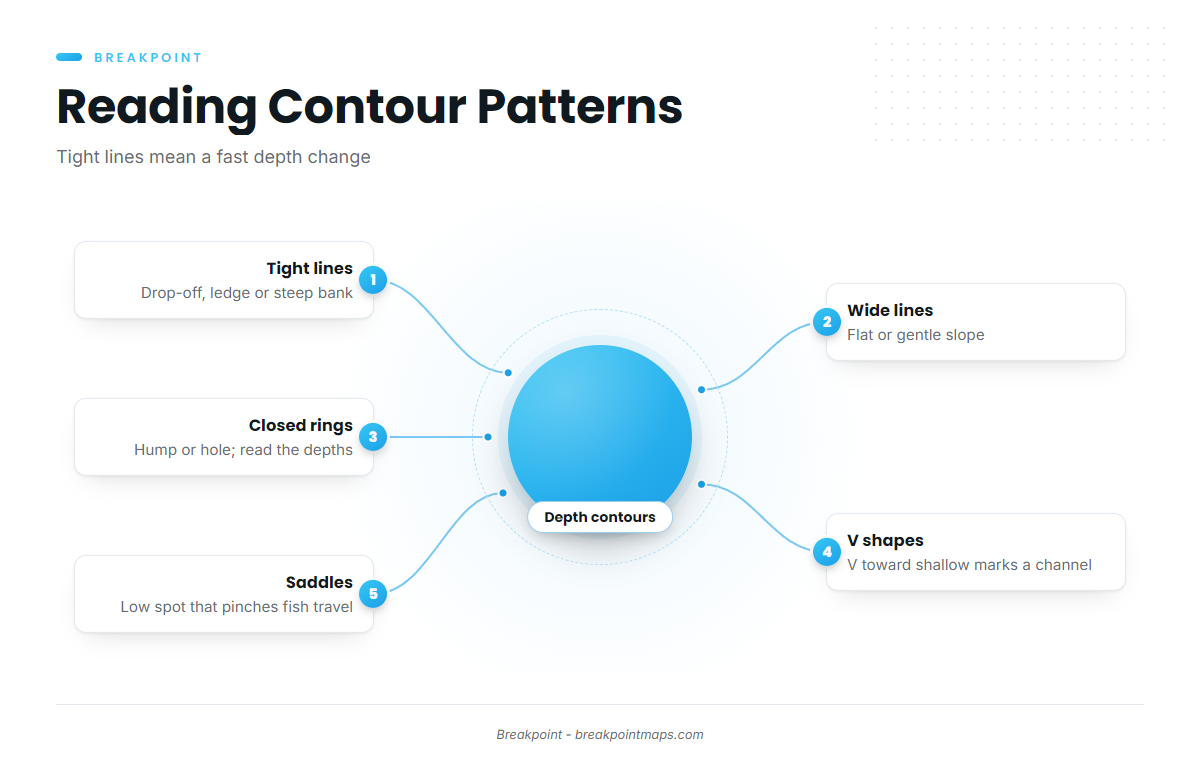
Tight lines mean the bottom changes depth fast, as at a drop-off, ledge or steep bank. Wide lines mean it changes slowly, as on a flat or gentle slope. A contour line joins points of equal depth, so the distance between lines is the distance the bottom takes to change.
The contour interval is the depth step between lines, and a finer interval shows smaller breaks. On a map with 10-foot lines, a 3-foot ledge between two lines never gets drawn.
Here is how the patterns read:
- Tight lines. A fast depth change: a drop-off, ledge, bluff bank or channel edge.
- Wide lines. A flat or gradual slope where fish roam to feed.
- Closed rings. A hump or a hole. Read the depth labels to tell which. Shallower in the center means a hump.
- V shapes and fingers. A V pointing toward shallow water marks a channel or creek cutting in. Lines bulging out toward deep water mark a point.
- Saddles. A low spot between two humps, or between a hump and shore. It works as a travel lane that pinches fish movement.
Fish use edges to change depth without traveling far, which is why ledges, humps and drop-offs hold fish. For points, saddles and channels in depth, see how to read bathymetry contours.
Two examples show the same skill in different water.
Freshwater. In a reservoir, the old river channel often survives on the bottom. It shows as a winding valley of tight lines through the basin, and where it swings against a point, the lines pinch.
Saltwater. On a shelf ledge, a band of bunched lines between two wide flats marks the break.
A common mistake is dropping a waypoint at the center of a hump. The structure is the edge and the change, so look at where the lines tighten.
Spacing tells you the shape of the bottom. Whether that shape was measured or guessed depends on the data.
Why Two Maps of the Same Bottom Disagree
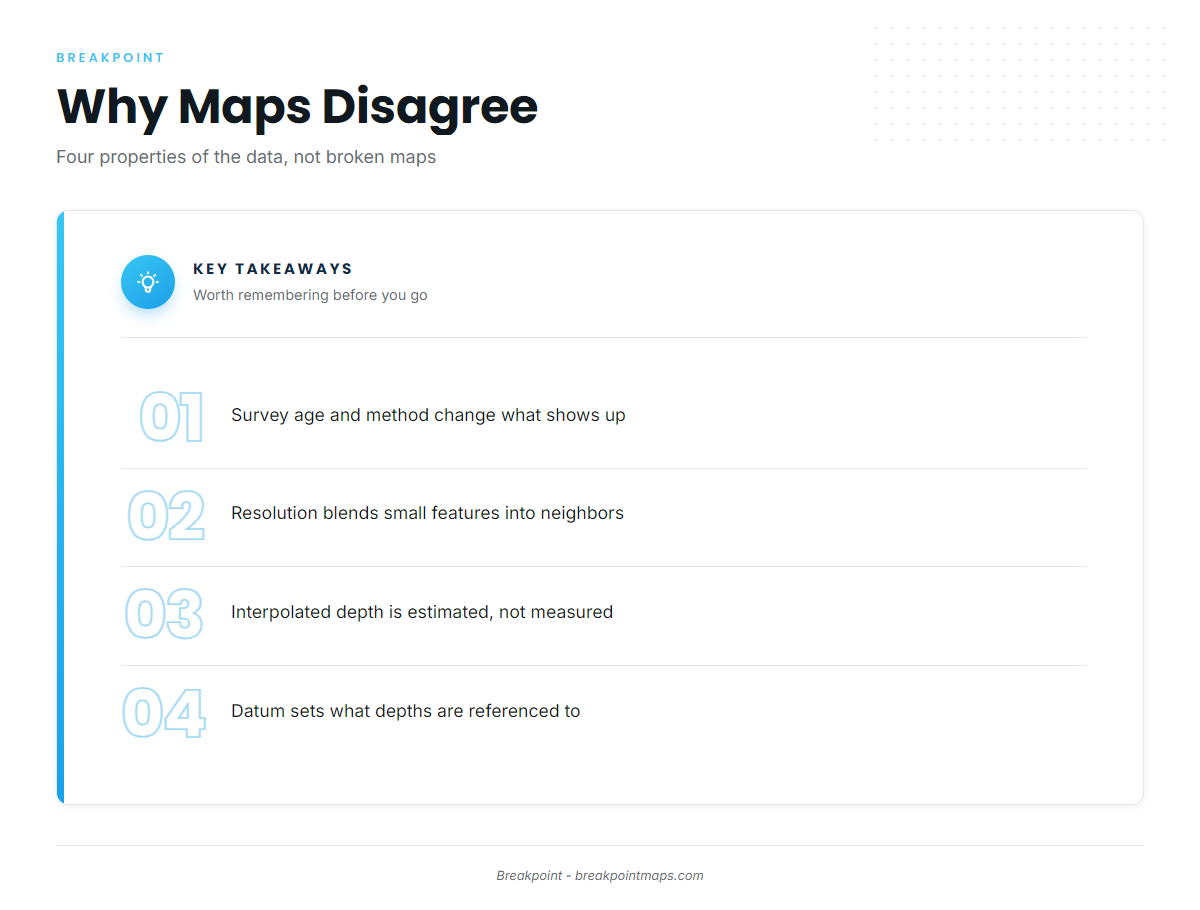
Maps disagree for four reasons: survey age and method, resolution, interpolated versus measured depth, and datum. Each is a property of the data, and none means one map is broken.
A single chart can blend surveys from very different eras and methods. NOAA’s own explainer on how accurate nautical charts are says a given chart can hold areas surveyed with a lead line next to areas surveyed with modern multibeam. The map you are reading may be several maps stitched together.
Survey Age and Method
Each survey method sees the bottom differently:
- Lead line. A weighted line dropped at points.
- Single-beam. One depth straight down along the boat’s track.
- Multibeam. A wide swath of depths across the track, giving full coverage.
- Lidar. Airborne laser for clear, shallow water.
The bottom changes too. Sand moves and channels shoal, so an old survey can be accurate for its day and wrong for yours.
Method also decides what shows up. If two single-beam lines run either side of a hump and neither crosses it, the hump is not on the map.
Resolution
A gridded map stores one depth per cell. Anything smaller than the cell, such as a rock pile or a narrow ledge, blends into its neighbors. The contour interval limits detail in the same way vertically.
A coarse grid smooths a sharp ledge into a gentle slope, and relief shading then shows a ramp where the bottom has a step.
Interpolated Versus Measured Depth
Measured depth is a depth a survey actually recorded. Interpolated depth is estimated between measured points to fill the gaps.
Smooth contours across a gap can be math rather than bottom. Shoaler or deeper spots can hide between survey lines, and interpolation can draw a flat over that hump. Two maps built from the same survey can still disagree if they fill the gaps differently.
Datum
Chart depths are referenced to a datum, a fixed low-water level, rather than to the water you are floating on.
Mean lower low water (MLLW) is the average of the lower of the two daily low tides, measured over a long period. U.S. coastal charts reference depths to it.
The sounder reads the water you are on, while the chart reads a low-tide reference. Most of the time the tide is above datum, so the sounder reads deeper than the chart.
Transducer offset is a second cause. The transducer sits below the waterline, and unless an offset is set, the sounder measures from the transducer instead of the surface.
Lakes and rivers can use their own low-water reference levels. Check the datum named on the chart or dataset. Maps built on different vertical datums will disagree by that difference everywhere. For datum and soundings in depth, see NOAA ENC soundings and depth areas.
How to Decide Which Map to Trust
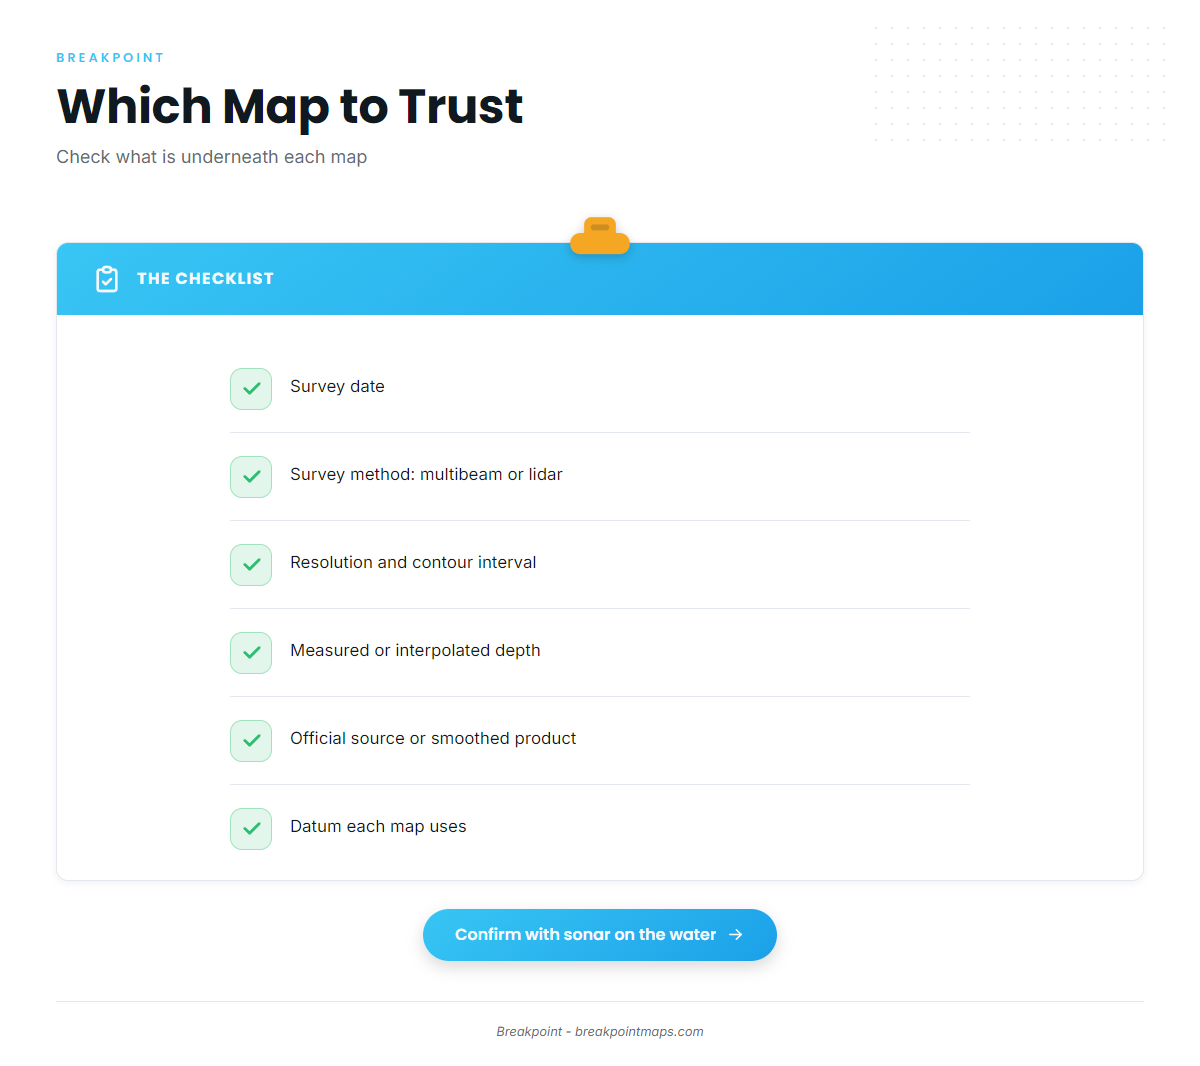
When two maps disagree, check what is underneath each one before you pick.
- Survey date. Look for it in the metadata or source notes. Newer usually beats older where the bottom moves.
- Survey method. Multibeam or lidar coverage beats scattered single-beam lines for small structure.
- Resolution and contour interval. The finer the grid, the smaller the feature it can hold.
- Measured or interpolated. Some datasets carry a quality or uncertainty layer. Use it.
- Source. An official survey compilation is not the same as a smoothed product built on top of it.
- Datum. Know what each map’s depths are referenced to before you compare numbers.
Use the map to choose where to look, then confirm with your own sonar when you get there.
Not for Navigation
Chart layers and bottom maps are not for navigation. Use official NOAA charts and the Coast Pilot.
Fishing maps help you choose where to fish. They do not replace the official chart, the Coast Pilot or the official forecast.
Official Sources for Bottom Data
These are public sources. Bottom maps built from them are still not for navigation.
NOAA data on its open data channels is open for public use. NOAA asks for attribution when you use unaltered data, and it does not allow you to imply NOAA endorsement or present modified data as original NOAA data.
Nautical charts and chart publications
- NOAA Interactive Chart Catalog – find and view official NOAA charts by area.
- How accurate nautical charts are – NOAA on why one chart can hold surveys of different ages and methods.
- U.S. Coast Pilot – NOAA’s written companion to the charts, covering channels, hazards and local notes, reachable through NOAA’s chart pages.
Bathymetry and survey data
- NOAA bathymetry open data – NOAA’s National Bathymetric Source products, including BlueTopo, a compilation of the nation’s best available bathymetric data for navigationally significant U.S. waters, delivered as GeoTIFFs with elevation, vertical uncertainty and source information.
- NCEI seafloor mapping and data viewer – an interactive map to search multibeam, single-beam, lidar and crowdsourced bathymetry, free to the public.
- GEBCO – an intergovernmental compilation of depths outside U.S. waters.
Wrecks, reefs and rigs
- Delaware artificial reef guide – DNREC site charts and coordinates for Delaware reef sites.
- Pinellas County artificial reef guide – reef positions and bearings off Pinellas County, Florida.
- Other coastal states run their own artificial reef programs through their fish and wildlife agencies.
- Wrecks, reefs and rigs as fishing structure – how to read and fish man-made structure.
Lakes and inland water
- USGS inland bathymetry – USGS surveys of selected rivers and lakes, plus an inventory linking to published survey data.
- Many state fish and wildlife agencies publish lake depth maps.
Related guides
- How to read bathymetry contourspoints, saddles and channels read from depth lines.
- Ledges, humps and drop-offsnatural structure and how fish use it.
- Wrecks, reefs and rigsman-made structure and its official positions.
- Reading NOAA ENC soundings and depth areasthe official chart’s depths, datum and depth bands.
- Ocean data for anglerstemperature and the other water data that sits above the bottom.
Frequently Asked Questions
What do tight contour lines mean?
Tight lines mean the bottom changes depth fast, as at a drop-off, ledge or steep bank. Wide lines mean a flat or gentle slope. Fish use the tight sections because they can change depth zones without swimming far.
What does MLLW mean on a chart?
Mean lower low water is the average of the lower of the two daily low tides, measured over a long period. U.S. coastal chart depths are referenced to it, so the actual water is usually deeper than charted.
Why does my sounder read differently from the chart?
The sounder reads the water you are on, while the chart reads a low-tide reference. Transducer offset adds to the gap. The survey’s age and method add more, since the bottom may have moved since it was measured.
What is interpolated depth?
Interpolated depth is estimated between measured points. Smooth contours over a gap can hide a hump between survey lines. Check the metadata or any uncertainty layer to see what was actually measured.
Can I use a fishing map for navigation?
No. Chart layers and bottom maps are not for navigation. Use official NOAA charts and the Coast Pilot. A fishing map helps you decide where to look.
Beyond the Bottom
Contour spacing shows shape. Survey method, resolution and interpolation determine how well that shape reflects the real bottom, and datum explains most of the gap between the chart and the sounder.
Shortlist edges at home, check each map’s source and date, and confirm with sonar on the water.
The bottom tells you where fish can hold. Water temperature and other ocean data indicate where they are likely to be; see ocean data for anglers. In Breakpoint, bottom layers such as Chart Contours sit alongside the ocean data covered in these guides.