


The short answer
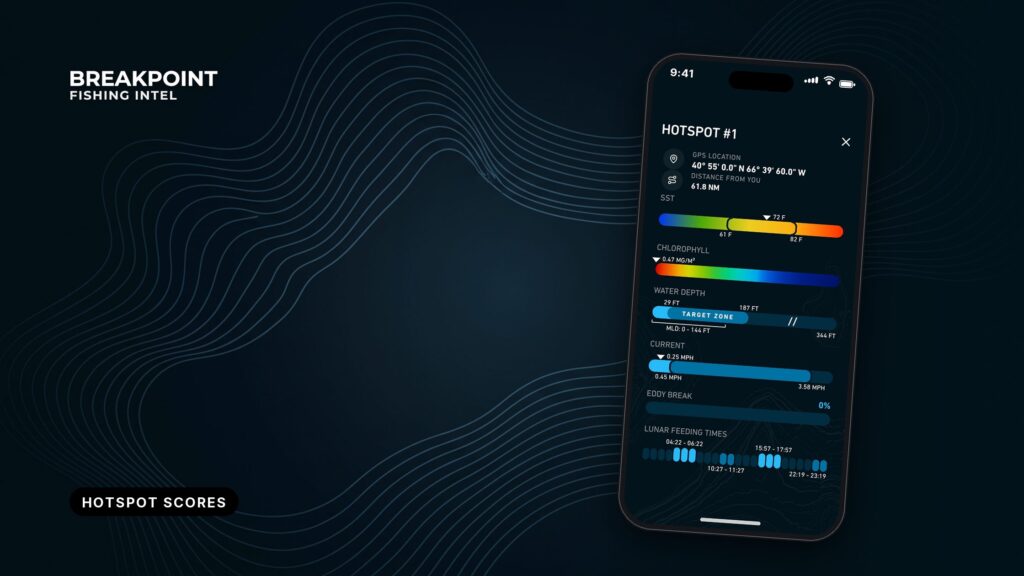
Breakpoint’s hotspot score combines six ocean inputs (water temperature, chlorophyll, currents, depth, bottom structure and season) into one daily rating for each species. It covers 30 species across 5 regions. A high score means conditions line up for your fish, but it doesn’t confirm the fish are there.
The score applies the reasoning an experienced angler uses when reading charts for a temperature break or a color edge, and it does so for each species every day. The aim is a better decision about where to look.
This page covers the inputs, why scores change, how to read a pin, and what the score can’t see.
The six inputs behind every score
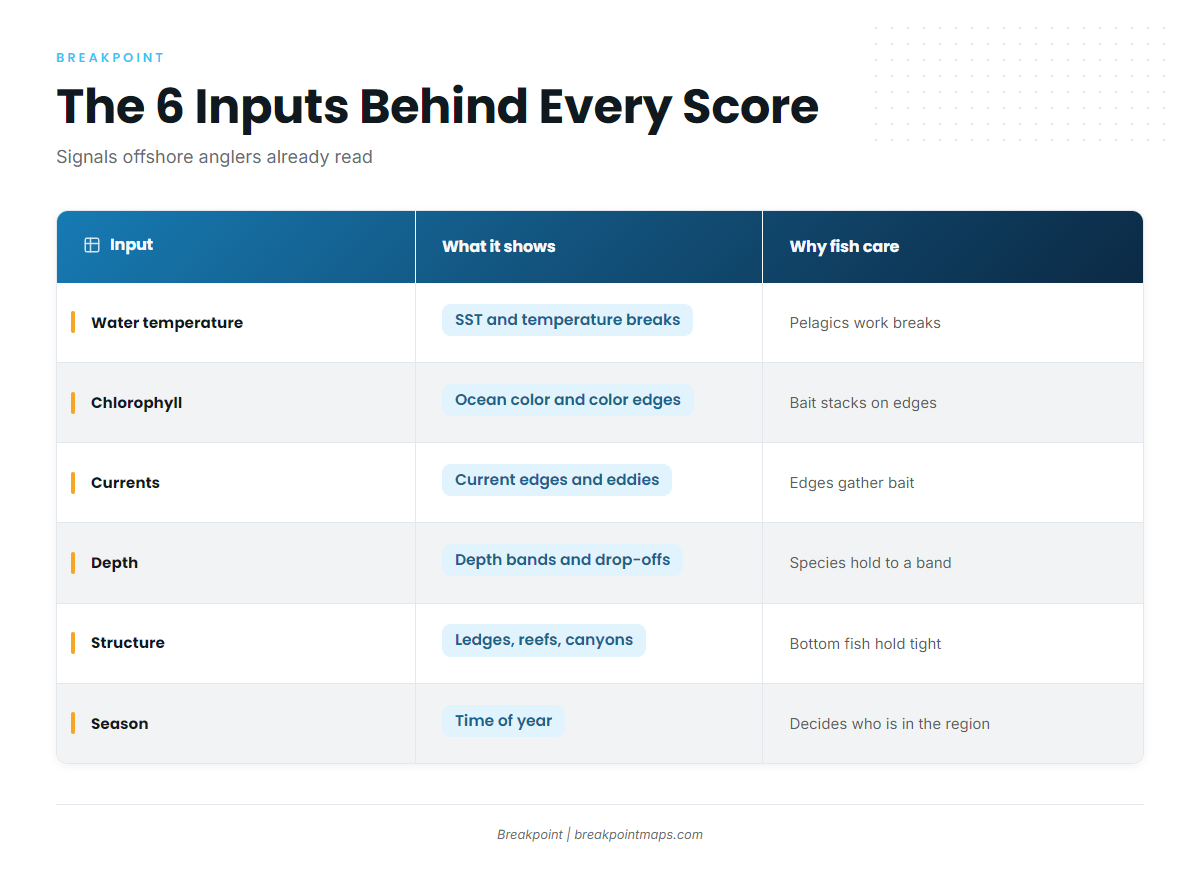
Each input is something offshore anglers already read on satellite fishing maps. The score reads them together instead of one at a time.
| Input | What it shows | Why fish care |
|---|---|---|
| Water temperature | Sea surface temperature and temperature breaks. Pairs with the OBS SST layer | Pelagics work temperature breaks and hold in their preferred range |
| Chlorophyll | Ocean color and color edges. Pairs with the Chlorophyll layer | Bait stacks on a color edge, and predators follow bait |
| Currents | Current edges and eddies | Edges and eddies gather bait and predators |
| Depth | Depth bands and drop-offs. Pairs with Chart Contours | Many species hold to a depth band |
| Structure | Ledges, reefs, canyons | Bottom species hold to structure |
| Season | Time of year | Season decides who is in the region at all |
Water temperature. Fish have a preferred range, and the edge between two water masses is where bait and predators often meet. A break on OBS SST is the first thing most captains look for.
Chlorophyll. Green water carries more plankton than blue water, and bait gathers where the two meet. The Chlorophyll layer shows that color edge.
Currents. A current edge or an eddy pushes bait together and holds it there. Fish that feed on bait set up along the same edge.
Depth. A species that lives on the bottom in 400 feet has no use for a surface break over 4,000 feet. Chart Contours show the bands and drop-offs the score checks against.
Structure. Ledges, reefs and canyons stack bait and hold bottom fish. A smooth bottom and a ledge at the same depth are different spots.
Season. Fish move through the year, and season sets which species belong in a region and when.
A 2-degree break means little if the fish you want lives on the bottom in 400 feet, which is why no single input decides the score.
How the inputs become one daily score
Each day’s conditions are matched against what each species prefers. The more inputs line up, the higher the score, and a pin lights up where several line up for your species.
The weighting is proprietary. What matters for how you fish is the reasoning, which you can check against the layers on the map.
The score summarizes conditions. It is not a sighting of fish.
Why the score changes by species and by day
Each of the 30 species is scored on its own preferences, so the same water can rate high for one species and low for another. Each species’ preferred temperature and depth are laid out on its Fish Intel page.
Same water, different fish
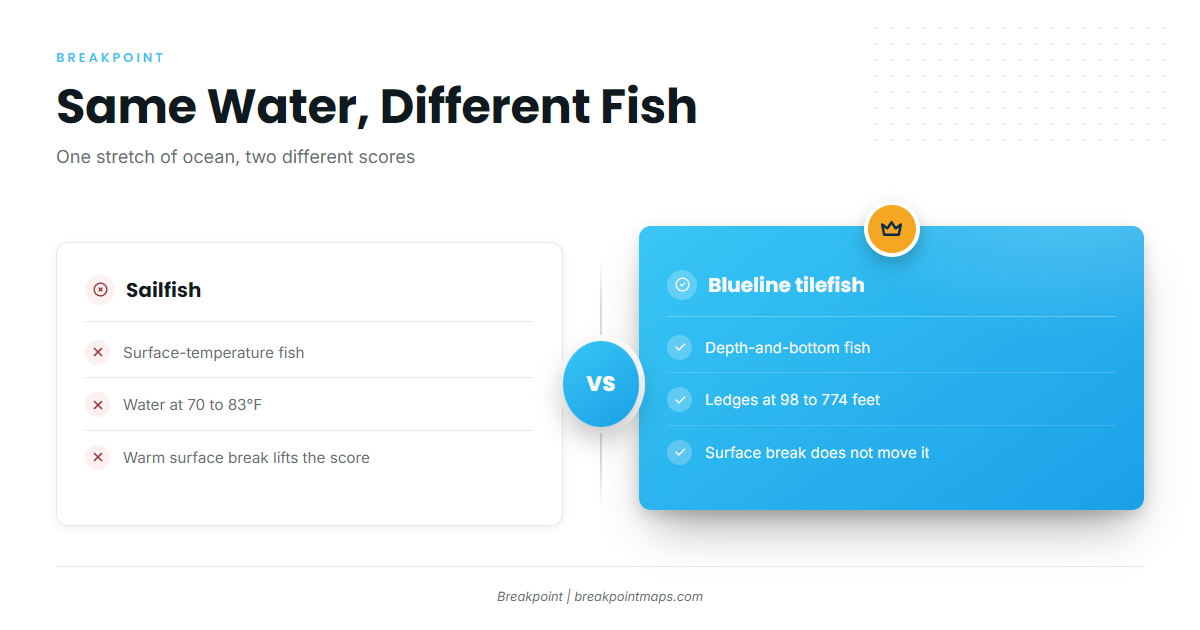
Take one stretch of water and score it for two species:
- Sailfish depend on surface temperature. Sailfish prefer 70 to 83°F water, so a warm surface break matters.
- Blueline tilefish depend on depth and bottom. NOAA’s blueline tilefish profile puts them on irregular bottom with ledges or crevices at 98 to 774 feet, in bottom water of 59 to 73.4°F.
A warm surface break can lift the sailfish score and do nothing for tilefish.
Why scores move day to day
Temperature edges shift, color edges drift, and currents and eddies move. Each change moves the daily score for the species it affects.
Season moves the score too. Black sea bass head to outer-shelf wintering grounds in fall, and the ASMFC black sea bass profile says that movement starts when bottom temperatures fall between 10 and 12°C. The same ledge can rate differently in October than it did in July.
How to read a hotspot pin
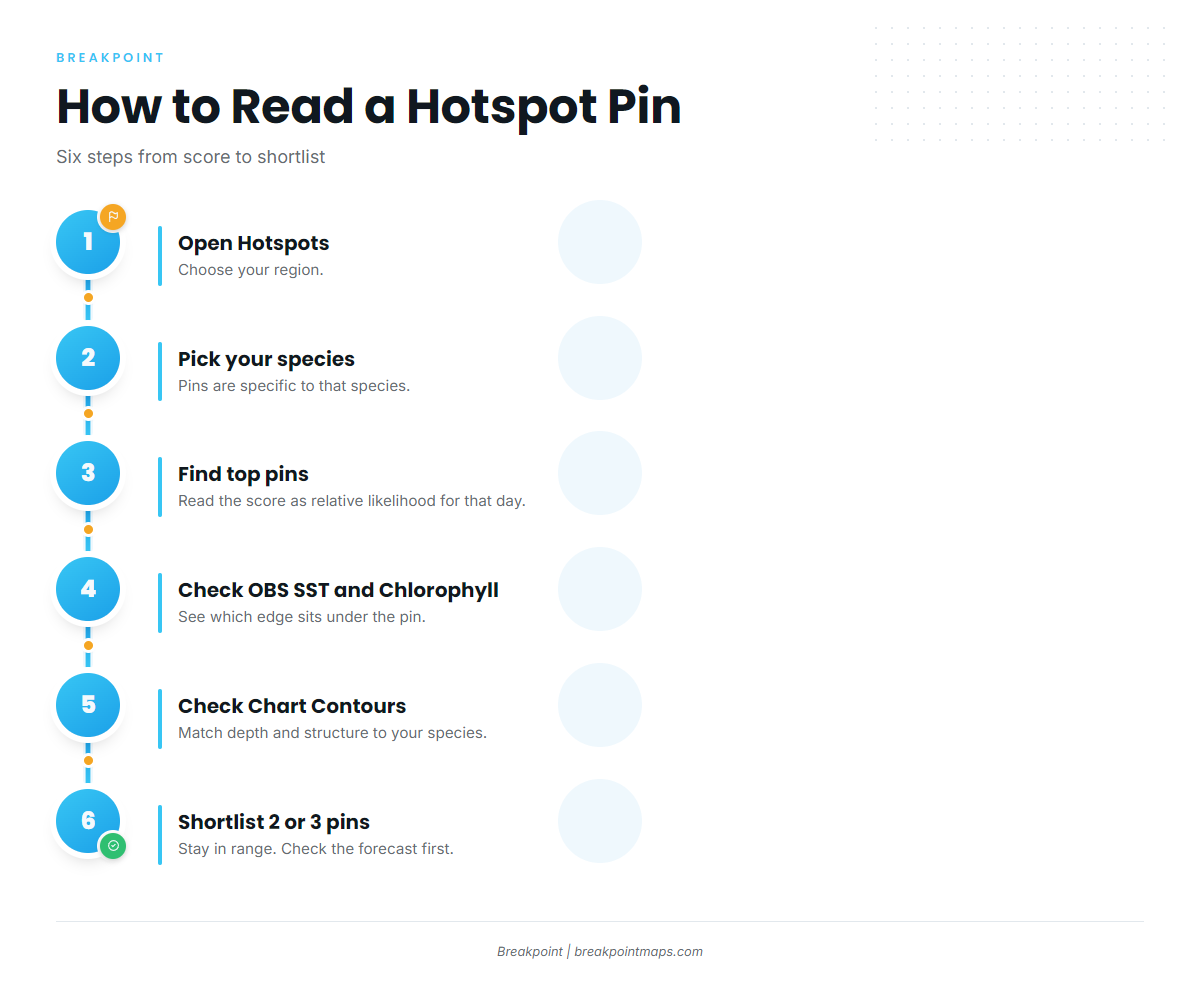
A pin marks the best-scoring spot for one species in one region on one day. Tap it and the app shows why it is there.
Work through it in this order:
- Open Hotspots and choose your region. Pins show for the region you pick.
- Pick your target species. The pins are specific to that species, and its Fish Intel page lays out its preferences.
- Find the highest-scoring pins. Read the score as relative likelihood for that species that day.
- Turn on OBS SST and Chlorophyll. See which edge sits under the pin.
- Turn on Chart Contours. Check depth and structure against what your species prefers.
- Shortlist 2 or 3 pins within your range. Check the forecast before you commit to any of them.
For a worked example, see a worked example with blackfin tuna.
Getting the most from a score
Use the score as the first filter, not the last word.
- Cross-check. Compare the pin against the layers, your own log and local knowledge. Many anglers keep a log and read fleet reports alongside the app.
- Have a Plan B. If the pin is quiet, work the next edge or the next pin on your shortlist.
- Keep the value in view. The score saves the time you would spend sorting charts. It doesn’t replace what you see on the water.
What the score cannot see
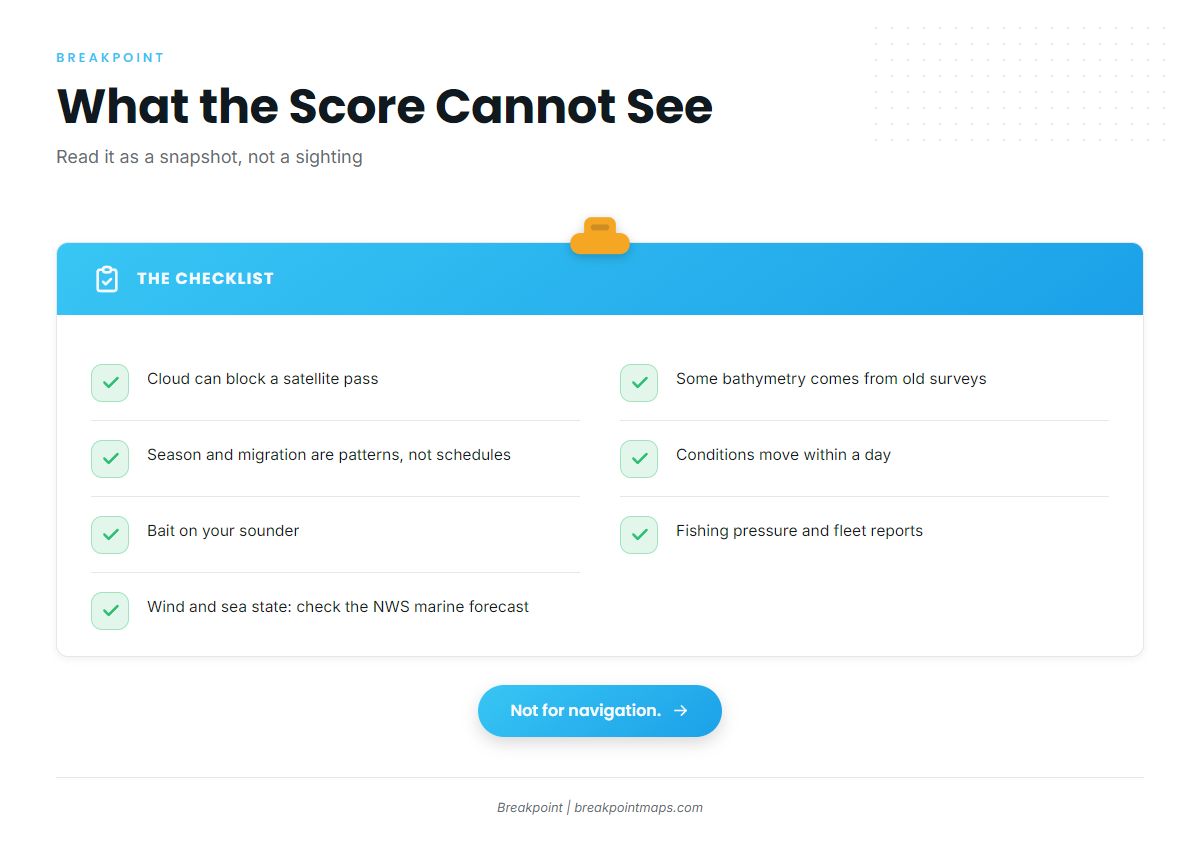
Every data source has limits. These are the ones that matter for a daily score:
- Cloud can block a satellite pass and leave gaps in the data.
- Bathymetry in some areas comes from old surveys.
- Season and migration are patterns, not schedules.
- Conditions move within a day, and a daily score is a snapshot.
- The score can’t see the bait you mark on the sounder, fishing pressure or the fleet’s report.
The score tells you where to look. When to fish is a separate question; see how we explain solunar tables and bite times.
Chart layers are not for navigation. The score does not consider wind or sea state, so check the official NWS marine forecast for wind, wave height and period before you go.
Rules differ by state and federal waters. Check with NOAA Fisheries or your state agency before keeping fish.
FAQ
What does a hotspot score mean?
It is a daily rating for one species that shows how well the six inputs line up in that spot: temperature, chlorophyll, currents, depth, structure and season. Read it as likelihood, not a promise. A higher score means better odds that conditions suit your fish.
Why did my score change overnight?
Temperature edges, color edges and currents move, and the season advances. Any of those can raise or lower a score for a species. Each day’s score reflects that day’s conditions, so a pin that rated high yesterday can drop today.
Does a high score mean fish are there?
No. It means conditions favor that species. Confirm with bait, your sounder and what you see on the water. The score points you to where to look, and your eyes and electronics take it from there.
Which species and regions are covered?
Breakpoint scores 30 species across 5 regions. Each species is scored on its own preferences. The Fish Intel page for a species lays out what it likes, including temperature and depth.
Does the score include weather or tides?
No. Wind and sea state are not inputs. Check the NWS marine forecast for wind, wave height and period. For timing, see our solunar tables and bite times post.
What happens on cloudy days?
Cloud can block satellite passes and leave gaps in the data. Read scores from those days with extra caution, and cross-check them against the layers and what you see on the water.
Where to go from here
The score rates six inputs for each species every day, to help you decide where to look. Download Breakpoint from the App Store or Google Play and read your first pins against the layers.