




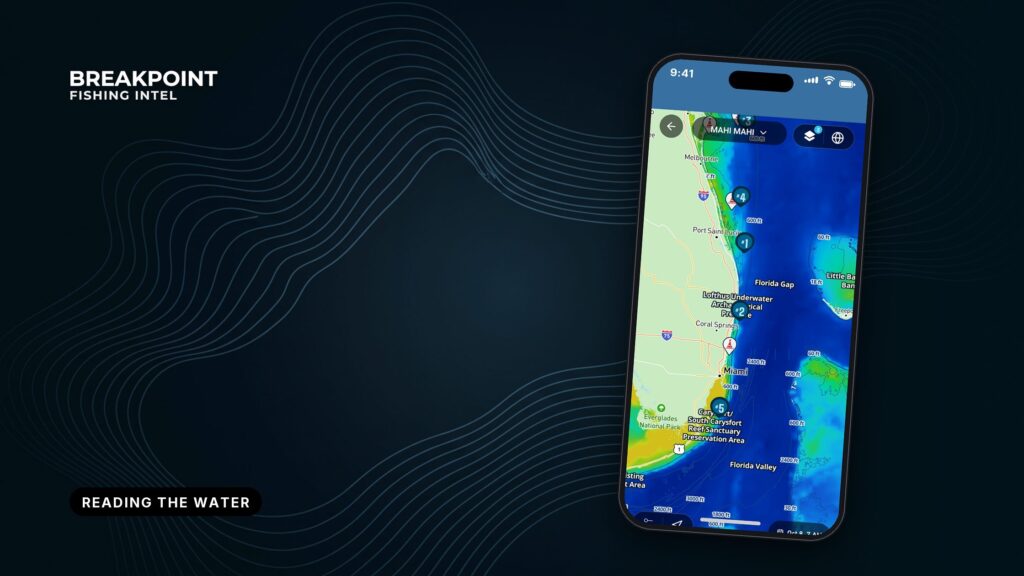
Not for navigation. Breakpoint charts are for trip planning. Navigate with official charts and your vessel’s instruments.
Reading the water means using three layers, temperature, color and current, to decide where an edge is worth the fuel. Temperature shows where water masses meet. Color shows whether that water is clean and alive. Current shows which way the edge is moving and where it piles up.
An edge is the line where two different bodies of water meet. Bait collects there, and predators follow. No layer finds an edge on its own. When the layers agree, you have a better basis for choosing where to look. When they don’t, the choice is a cheaper one.
Three Layers, Three Questions
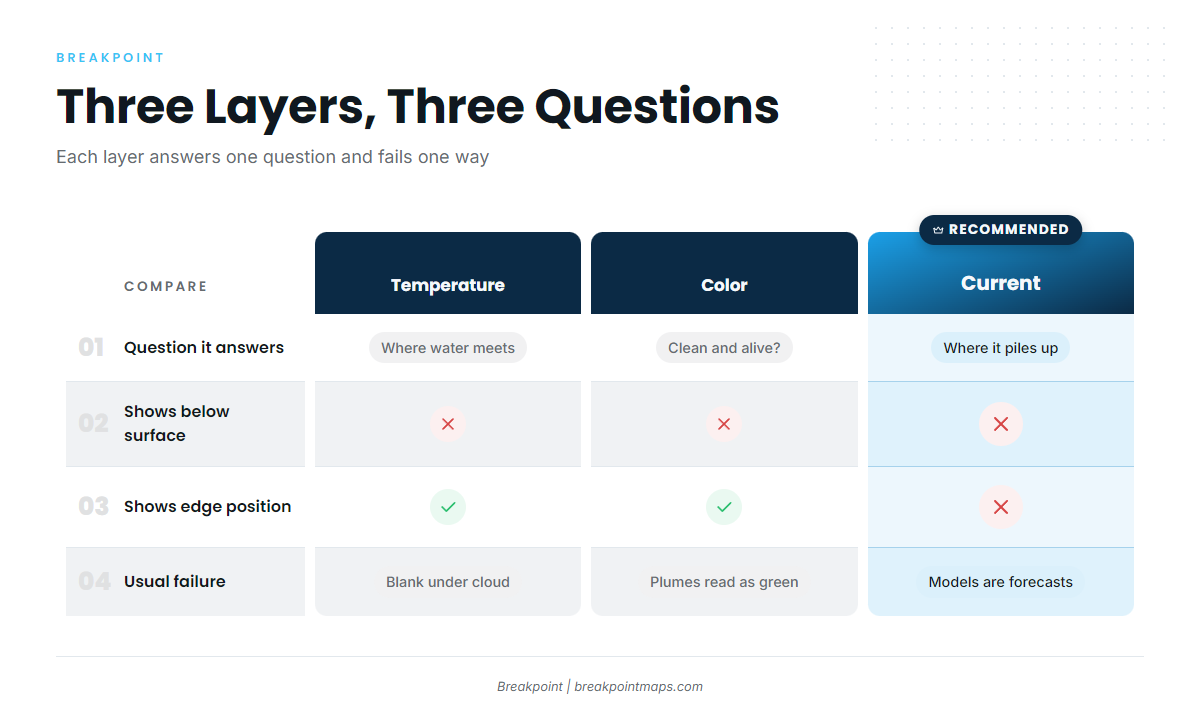
Each layer answers one question and fails in one predictable way.
| Layer | What it shows | The question it answers | What it cannot tell you | Its usual failure |
|---|---|---|---|---|
| Sea surface temperature | Warm and cool water masses, temperature breaks, eddies, upwelling | Where do water masses meet? | Whether the water holds bait, or what is happening below the skin | Blank under cloud (observed). Softened or invented edges (blended) |
| Water color (Chlorophyll) | Clean blue water vs green, productive or turbid water, color edges | Is that water clean and alive? | Temperature, or whether green means plankton or sediment | River plumes and runoff read as productivity. Cloud, haze and glare gaps. Often a day behind |
| Current | Direction and speed, convergence, eddy rotation | Which way is the edge moving, and where does it pile up? | Exact edge position, or what is in the water | Model currents are forecasts, and observed coverage is patchy |
Swipe the table sideways to see every column.
Sea Surface Temperature
Satellites read the temperature of the skin of the sea, and NOAA and NASA satellites supply the observed imagery. A temperature break is a place where water temperature changes quickly over a short distance. For the mechanics of finding one on a chart, see how to read a temperature break on an SST map.
SST also shows upwelling, which is cold, nutrient-rich water rising toward the surface. It appears as a cool patch, often matched by green on the color layer.
Observed SST goes blank under cloud and reads only the surface, so a strong break on the map can sit over water that looks different 20 feet down. The section on observed and higher-resolution layers below covers how to handle the gaps.
What SST gives you:
- Warm and cool water masses
- Breaks, fingers and eddies
- Cool upwelling patches
- A starting point, not a verdict
Water Color
Ocean color sensors estimate chlorophyll, the pigment in plankton. VIIRS, OLCI and PACE ocean color are the satellite sources. Blue and purple mean clear, low-chlorophyll water. Greens and warmer colors mean more productive or more turbid water. A color break is the line where clean blue water meets greener water. The Chlorophyll layer in the app draws it, and reading chlorophyll and water color maps explains the scale.
The sensor cannot tell plankton from river sediment, so a river plume reads as productive water. The greenest water is often too dirty for pelagics. Cloud, haze and glare leave gaps, and color imagery often lags by about a day. Why clean water beats green water covers how to spot the difference.
The usual target is the clean side of a color break rather than the greenest water on the chart.
Current
Convergence is where currents push water together, piling up bait and weed. An eddy is a spinning ring of water that has broken off a main current. Warm-core eddies show as round warm patches and cold-core eddies as round cool patches. Fish work the rims rather than the centers.
Three sources feed the layer, and each has a limit:
- HF radar gives observed surface currents near the coast, where coverage exists. It does not reach far offshore.
- Model currents are forecasts. They fill the gaps, and they can be wrong about where an edge sits.
- Altimetry (sea surface height) shows eddies and current meanders, even under cloud. It shows large features, not the edge itself.
Weed lines and sargassum often mark where current is working. For eddies, convergence and sources in detail, see ocean currents and eddies offshore. Current and temperature read best together, and NASA’s global sea surface currents visualization shows both at once, with flow colored by sea surface temperature. It is a science visualization, not fishing guidance.
Reading the Water Together, From the Whole Region to One Edge
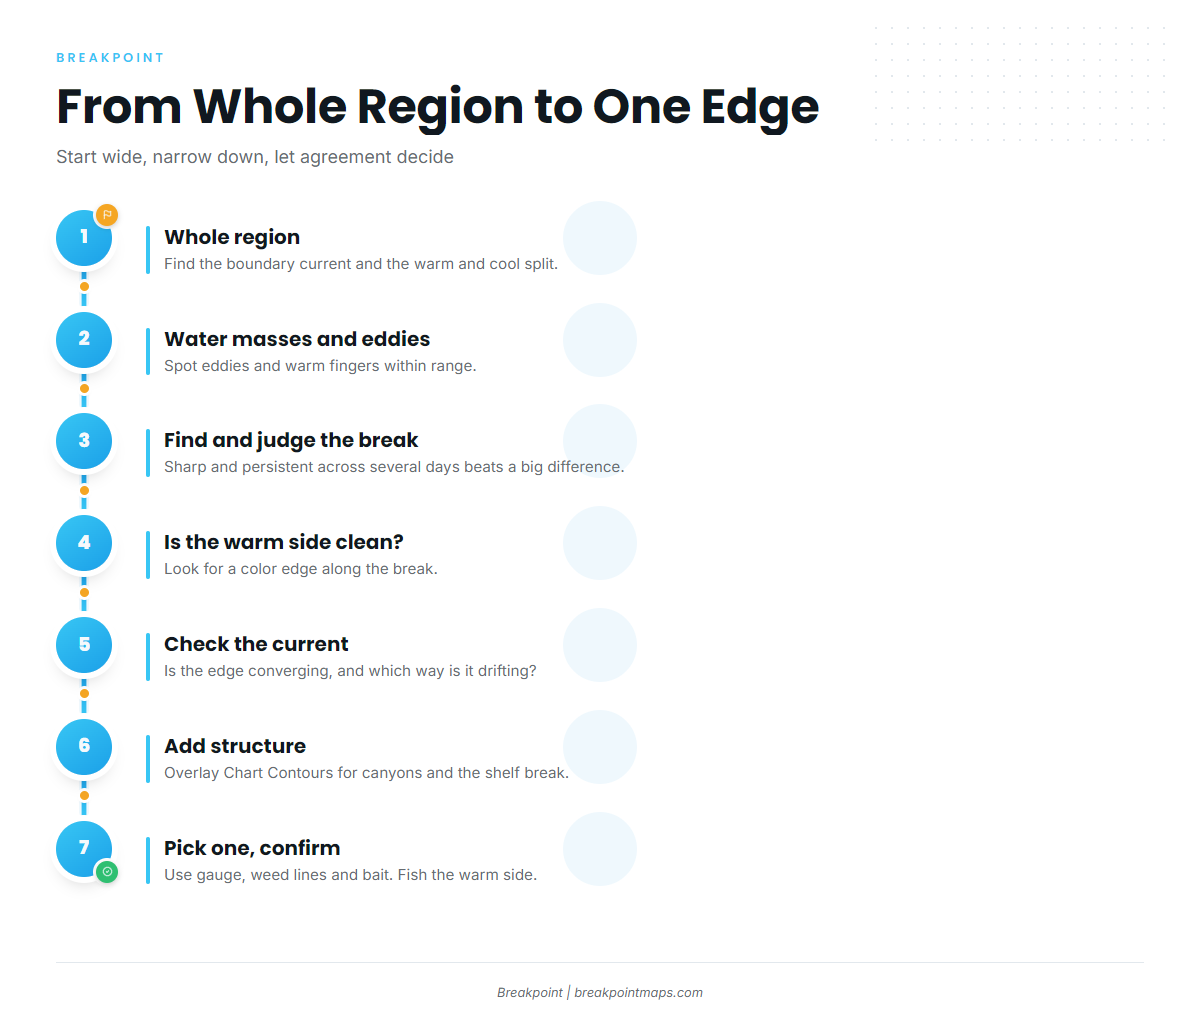
Start wide, narrow down, and let agreement between layers decide. Temperature tells you where to start looking. Your gauge and sounder tell you the rest.
- Whole region. Find the boundary current and the warm/cool split. The Gulf Stream is the western boundary current to read on all three layers, and fishing the Gulf Stream edge walks through it. In the Gulf of Mexico, fishing the Loop Current is the counterpart.
- Water masses and eddies. Identify eddies and warm fingers within range. The currents and eddies guide covers how they show up and why fish work their rims.
- Find the break and judge it. Sharpness and persistence across several days of imagery matter more than the raw temperature difference. A sharp line that holds its position beats a soft one that smears. Reading temperature breaks covers how to judge one.
- Is the warm side clean? Look for a color edge along the temperature break. A clean-water edge along the same line is a stronger target, and clean water on chlorophyll maps shows what to look for.
- Current. Check whether the edge is converging and which way it is drifting. Expect it to have moved since the last image.
- Structure. Overlay Chart Contours to see where canyons and the shelf break hold the edge in place.
- Pick one edge, then confirm on the water. Use the transom gauge, weed lines and bait on the sounder. Fish along the warm side of the edge, not through it.
In the app, stack OBS SST, Chlorophyll and Chart Contours to see whether the edge you picked lines up on all three. Chart layers are not for navigation.
When the Layers Disagree
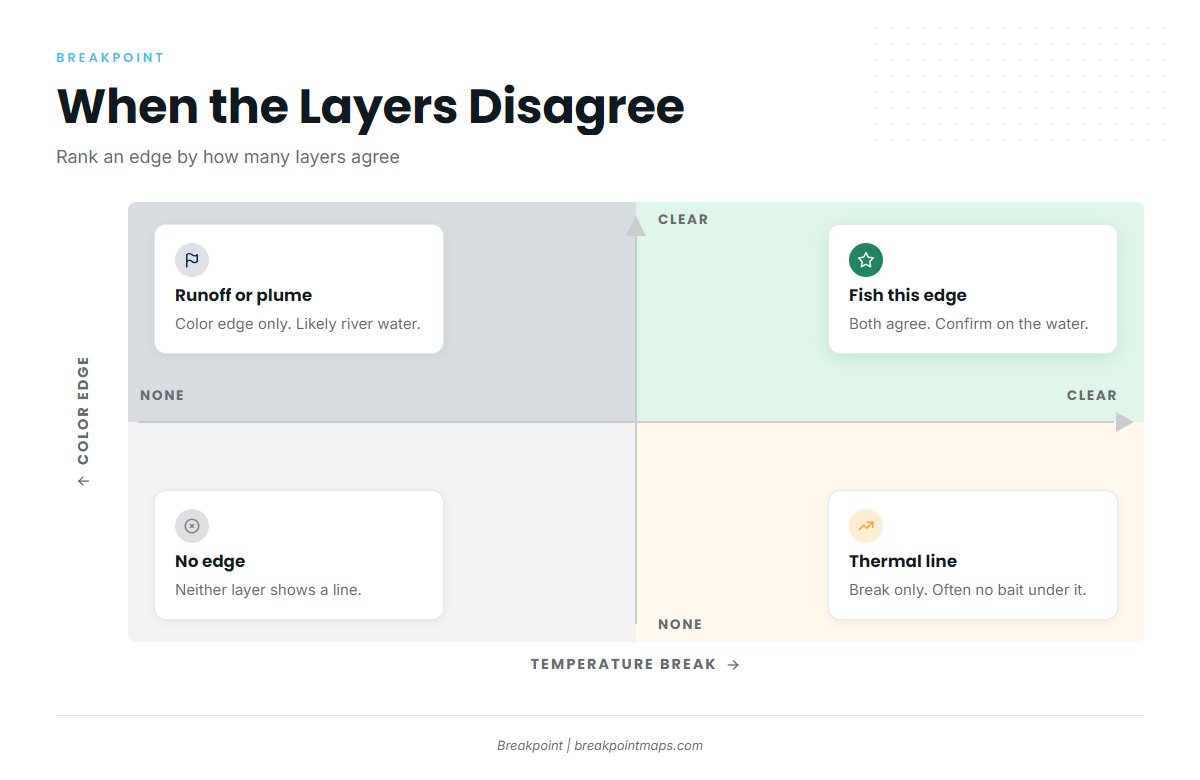
- A temperature break with no color change is often just a thermal line with no bait under it.
- A color edge with no temperature change may be runoff or a river plume.
- When layers conflict, trust the most recent clear observation, and treat a single-layer edge as lower priority.
Observed or Higher-Resolution Temperature
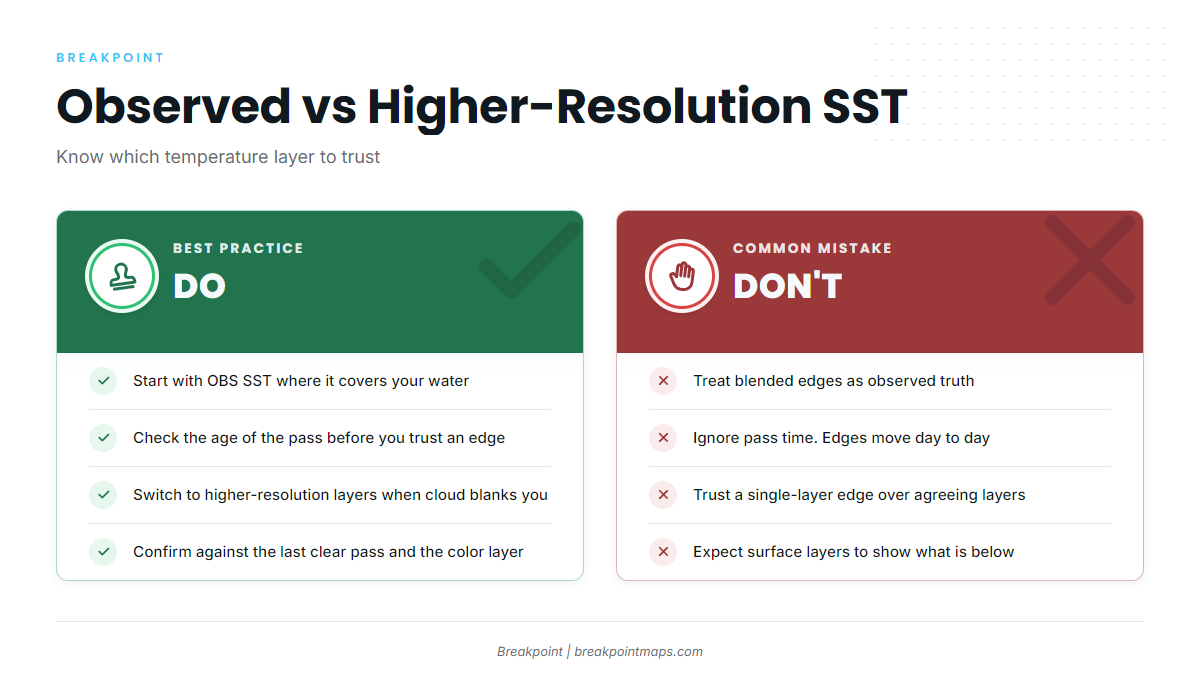
Use observed SST when it covers your water and is recent. Use higher-resolution temperature layers to fill cloud gaps and see structure, then confirm against the last clear observed pass and the color layer.
Observed SST is the truth where a satellite had a clear pass, and it is blank under cloud. Blended and higher-resolution products are interpolated or modeled. They give coverage and detail, but they can soften a real break or draw one that is not there.
| Observed SST | Higher-resolution temperature | |
|---|---|---|
| Strength | Measured where the satellite saw clear sky | Full coverage, finer structure |
| Weakness | Blank under cloud | Can soften or invent edges |
| Use it for | Confirming a break is real | Filling gaps, scouting structure |
| Check it against | Its own pass age | The last clear observed pass and color |
Every image has an age, and edges move from day to day, so pass time matters. Where ocean data comes from explains the sources and how old each layer is.
Turn on OBS SST first. Switch to the higher-resolution layer when cloud blanks your area, and check it against the last clear OBS SST pass.
Beneath the Surface
The thermocline is the layer where water temperature drops quickly with depth, below the warm, mixed surface layer. Satellites read only the skin, so surface layers cannot see the thermocline or the depth of the mixed layer. A strong surface break can sit over fish holding deeper, and the reverse.
Confirm with your sounder and gauge. The thermocline explained for offshore anglers covers what the surface layers cannot see.
Every Reading-the-Water Guide
Every guide in the series, grouped by topic.
Start here
- Ocean data for anglers – where satellite and model data come from, and how old each layer is.
Temperature
- Reading an SST map for temperature breaksreading colors and scales on an SST map.
- Judging temperature breaksjudging sharpness and persistence.
Color
- Chlorophyll and water color mapswhat the color scale means.
- Chlorophyll and clean waterwhy clean water beats green water, and how to spot plumes.
Currents and regional water
- Currents and eddies for offshore fishingconvergence, eddies and current sources.
- Gulf Stream edge guidereading the Gulf Stream on all three layers.
- Loop Current fishing guidethe Loop Current and its eddies in the Gulf.
Below the surface
- Thermocline guide for offshore anglers – what the surface layers cannot see.